Overview
The Web Application Scanner (WAS) Dashboard provides a centralized view of your application security posture. It highlights vulnerability trends, severity distribution, and critical risks across all scanned applications.Security Overview
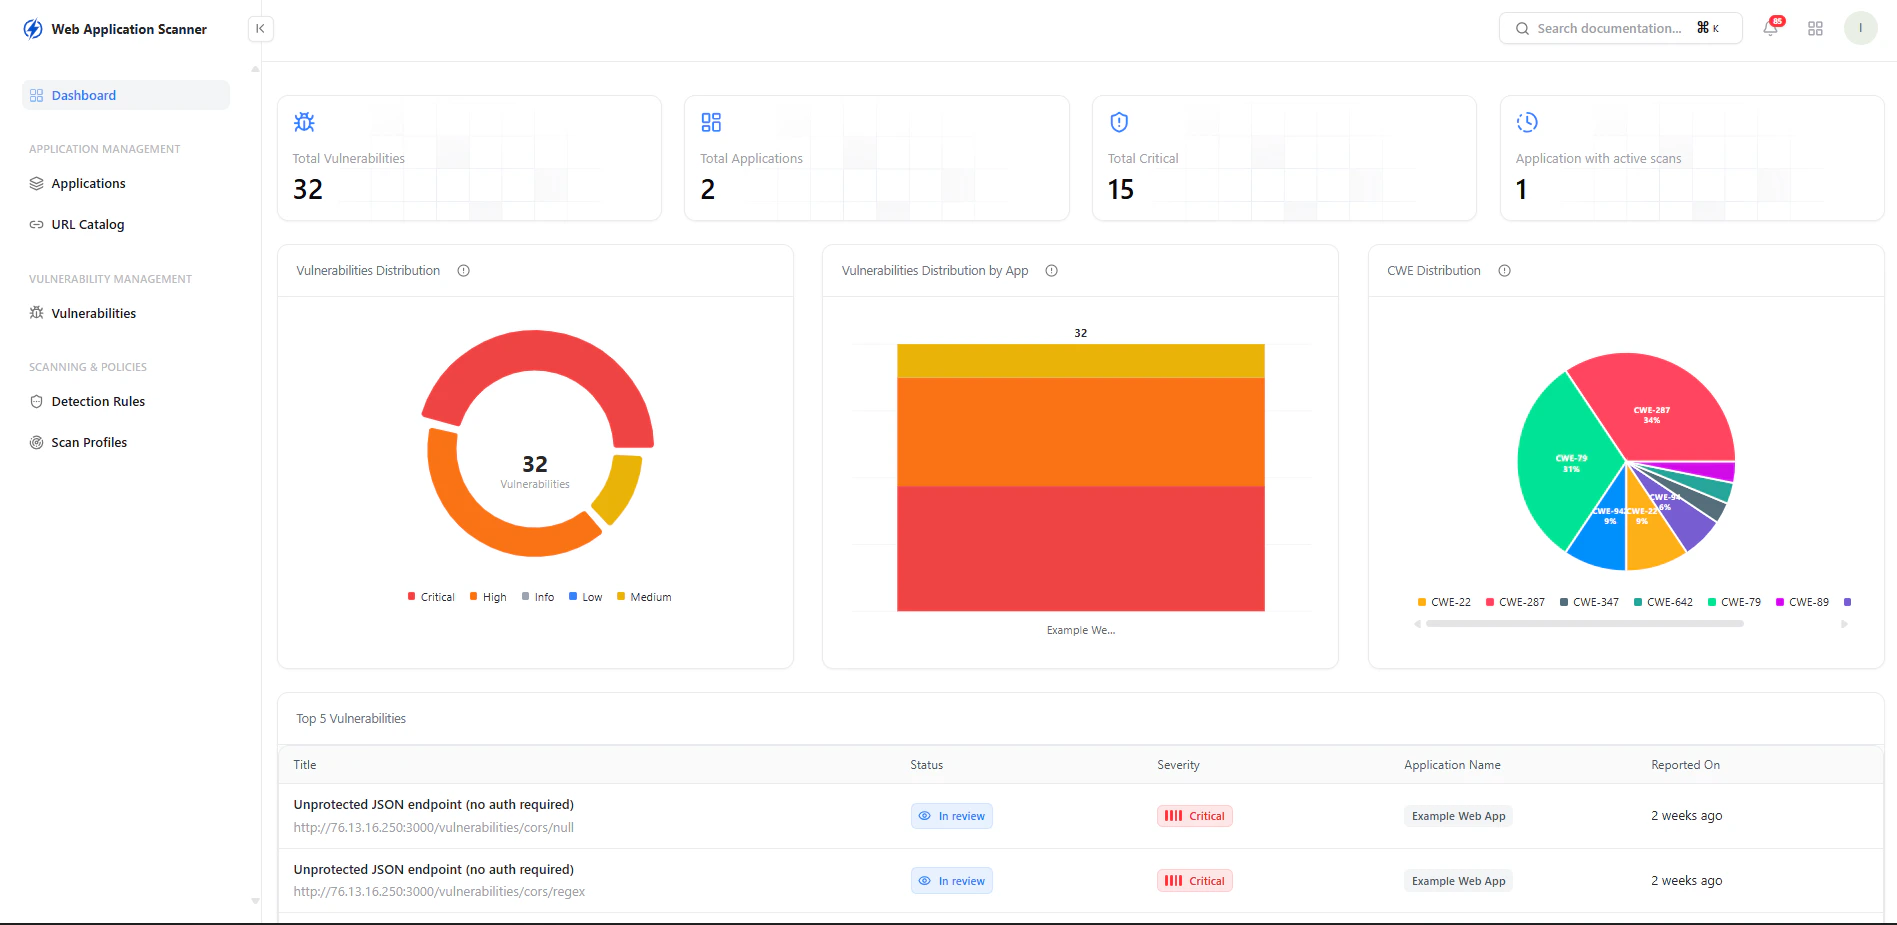
Key Metrics
- Total Vulnerabilities — Overall findings across applications
- Total Applications — Applications under monitoring
- Critical Vulnerabilities — High-risk issues requiring immediate action
- Applications with Active Scans — Currently monitored apps
Vulnerability Insights
Distribution Views
-
Severity Distribution
Breakdown of vulnerabilities by Critical, High, Medium, Low, and Info -
Vulnerabilities by Application
Identify which applications carry the highest risk -
CWE Distribution
Understand vulnerability types based on CWE classification
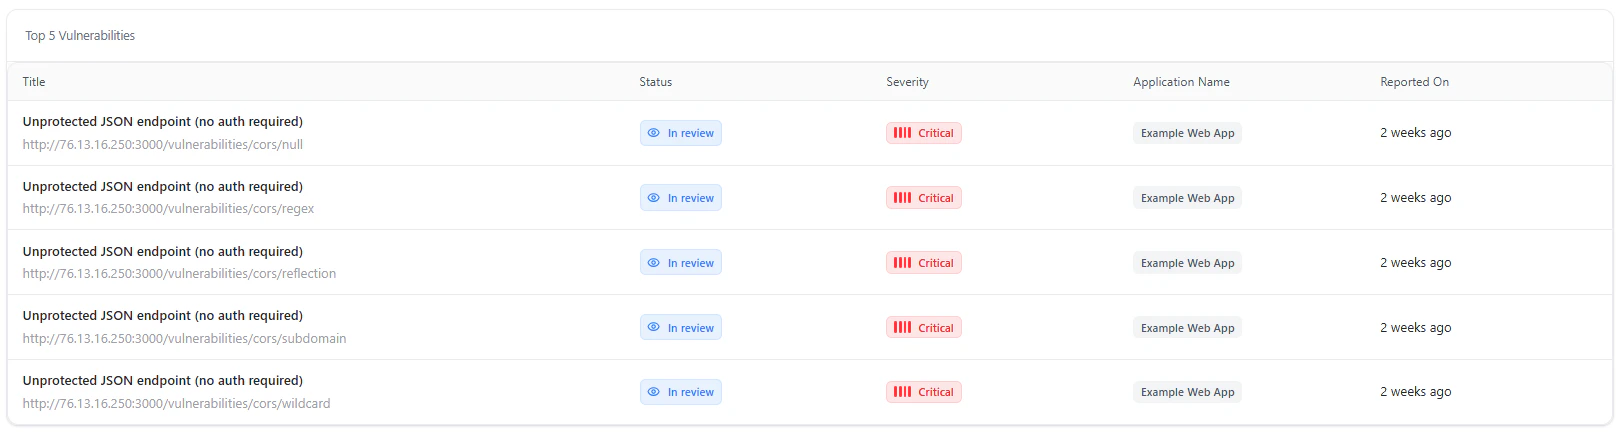
Top Vulnerabilities
The dashboard highlights the most critical vulnerabilities detected across applications.Key Details
- Title — Vulnerability type and endpoint
- Status — In Review, Open, Resolved
- Severity — Risk level
- Application Name — Affected application
- Reported On — Detection timeline
Use Cases
- Monitor application security posture in real time
- Identify high-risk applications instantly
- Track vulnerability trends over time
- Prioritize critical vulnerabilities for remediation
Why This Matters
- Provides complete visibility into application-layer risks
- Enables faster detection of exploitable vulnerabilities
- Helps prioritize fixes based on severity and impact
- Strengthens overall application security posture
Explore Live Demo
Explore WAS Live — No Signup Needed
Experience how Snapsec WAS identifies vulnerabilities across your web applications in real time.