Overview
The Severity Distribution view helps teams instantly understand the threat landscape by categorizing findings into Critical, High, Medium, and Low severity levels.This gives a clear snapshot of overall project risk and highlights where attention is needed most.
Overview
Severity Distribution provides a project-wide risk snapshot, showing how threats are distributed across severity categories. This allows teams to quickly identify:- Whether Critical or High severity threats dominate
- Which services or endpoints carry the highest impact
- How severity changes over time as threats are added, triaged, or resolved
- Imbalances pointing to systemic design flaws or weak areas
What Severity Distribution Shows
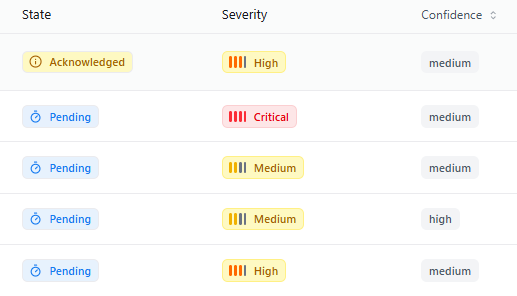
Threat Severity Breakdown
View counts of Critical, High, Medium, and Low severity threats across your project.
Endpoint & Service Hotspots
Understand which APIs or services hold most of the high-severity threats.
Trend Insights
Track severity changes over time as threats are generated or mitigated.
Prioritization Signals
Identify areas that require immediate security engineering focus.
Why Severity Distribution Matters
Ensures teams prioritize high-impact threats first
Helps engineering estimate workload and remediation timelines
Surfaces systemic weaknesses in architecture
Offers leadership a clear, data-driven view of project risk posture
How Snapsec Calculates Severity
Analyze Threat Metadata
Severity is determined based on exploitability, impact, environment, and system context.
Apply CWE & OWASP Mappings
Severity levels align with industry standards mapped to CWE and OWASP categories.
Account for Exposure
Threats affecting exposed or public-facing endpoints may be bumped to higher severity.
What Problems This Solves
Unclear Priorities
Teams know exactly which threats require immediate triage.
Overloaded Engineering Teams
Helps distribute tasks based on severity-driven workload.
Invisible High-Risk Areas
Highlights endpoints or flows with concentrated critical threats.
Use Cases
Sprint Planning
Use severity data to plan security engineering tasks and remediation cycles.
Leadership Reporting
Deliver executive summaries of threat severity trends and project posture.
Architecture Review
Identify weak system components that attract recurring high-severity issues.
Continuous Threat Monitoring
Track how fast high-severity threats are being resolved or discovered.
Explore Live Demo
Explore Snapsec Live — No Signup Needed
Jump straight into the live environment and see how Snapsec unifies asset intelligence, threat detection, and vulnerability tracking — all in one dashboard.