Overview
SLA Analytics provides a real-time view of how effectively your organization is resolving vulnerabilities within defined timelines. It transforms SLA tracking from a passive metric into an active operational system — helping teams identify breaches, enforce accountability, and continuously improve remediation performance. You can monitor:- SLA compliance across all vulnerabilities
- Breached and at-risk issues
- Team and owner performance
- Severity-based remediation trends
Every vulnerability is continuously tracked against SLA deadlines — ensuring zero blind spots in remediation timelines.
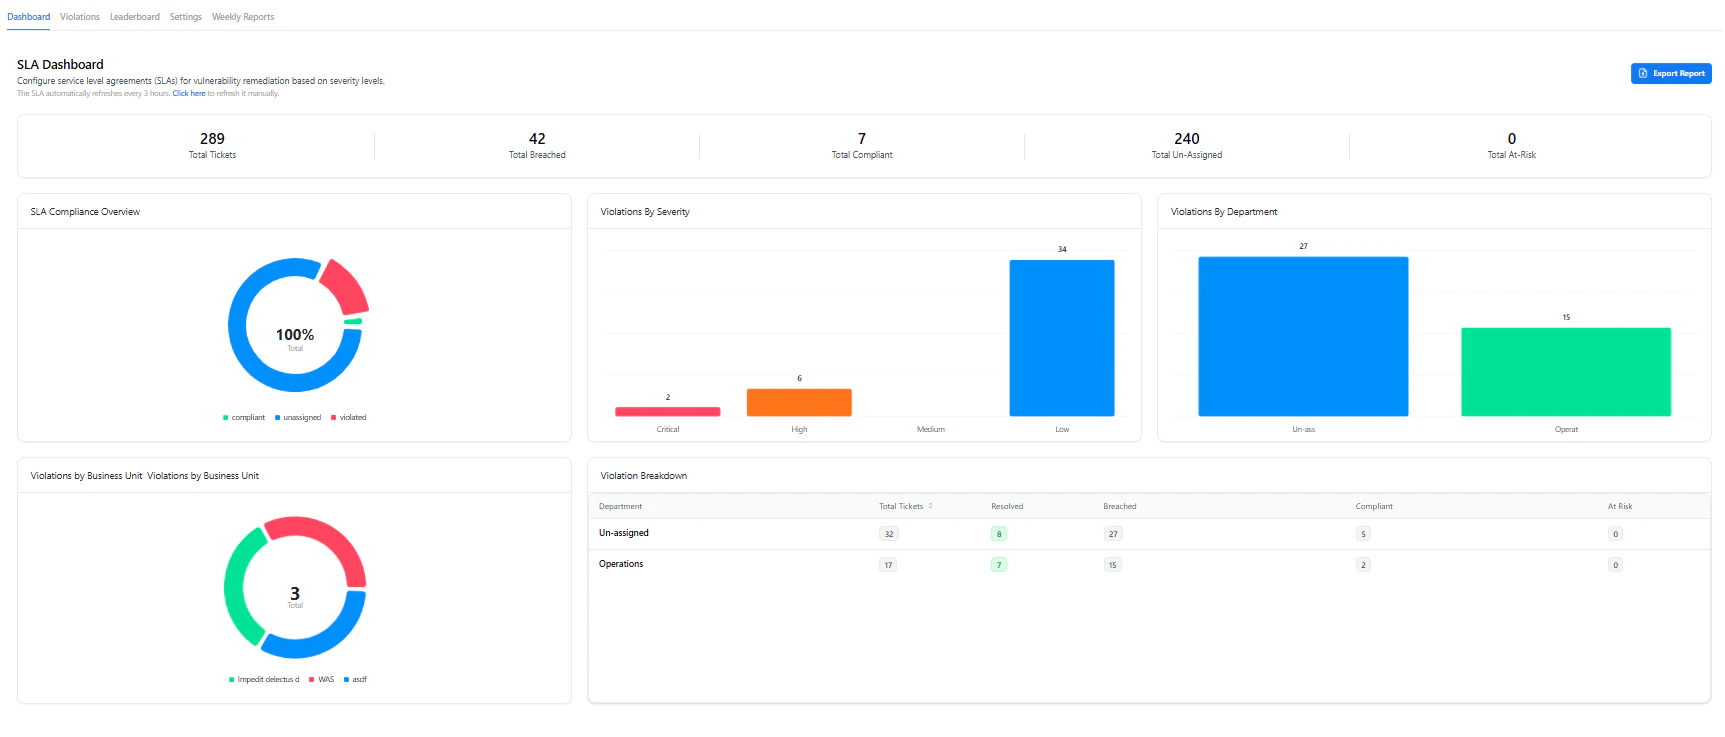
SLA Dashboard
The Dashboard gives a high-level snapshot of SLA performance across your organization.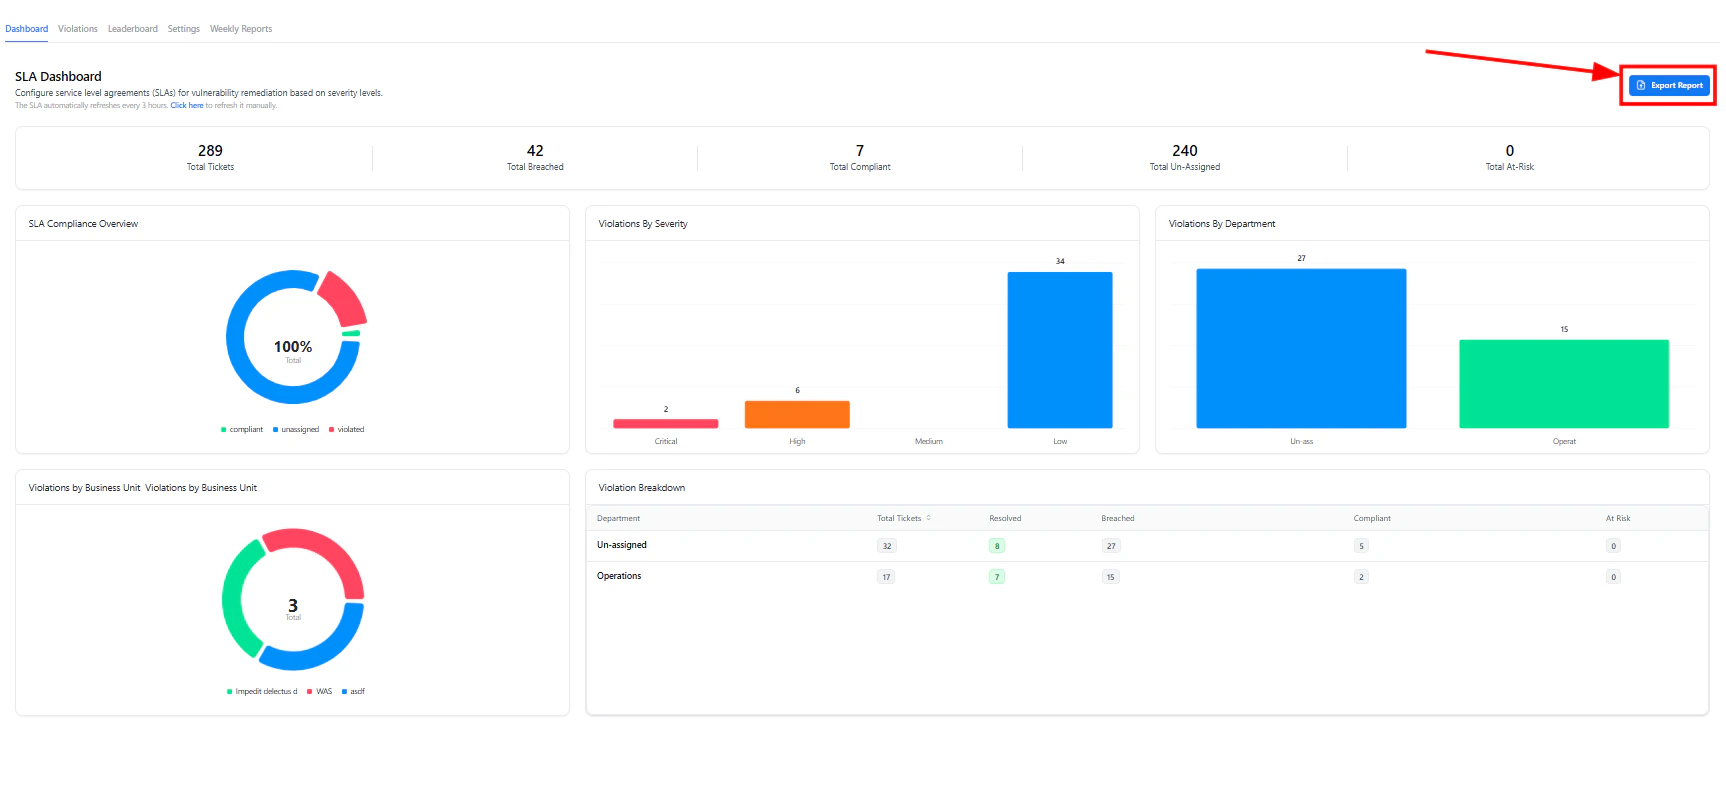
Key Metrics
- Total Tickets — All tracked vulnerabilities
- Total Breached — Issues that exceeded SLA timelines
- Total Compliant — Resolved within SLA
- Unassigned — Vulnerabilities without ownership
- At Risk — Close to breaching SLA
Visual Insights
-
SLA Compliance Overview
- % of compliant vs breached vulnerabilities
-
Violations by Severity
- Identify which severity levels are failing SLAs
-
Violations by Department
- Understand which teams are lagging
-
Business Unit Breakdown
- Track SLA performance across organizational units
The dashboard refreshes automatically, ensuring decisions are always based on current data.
SLA Violations
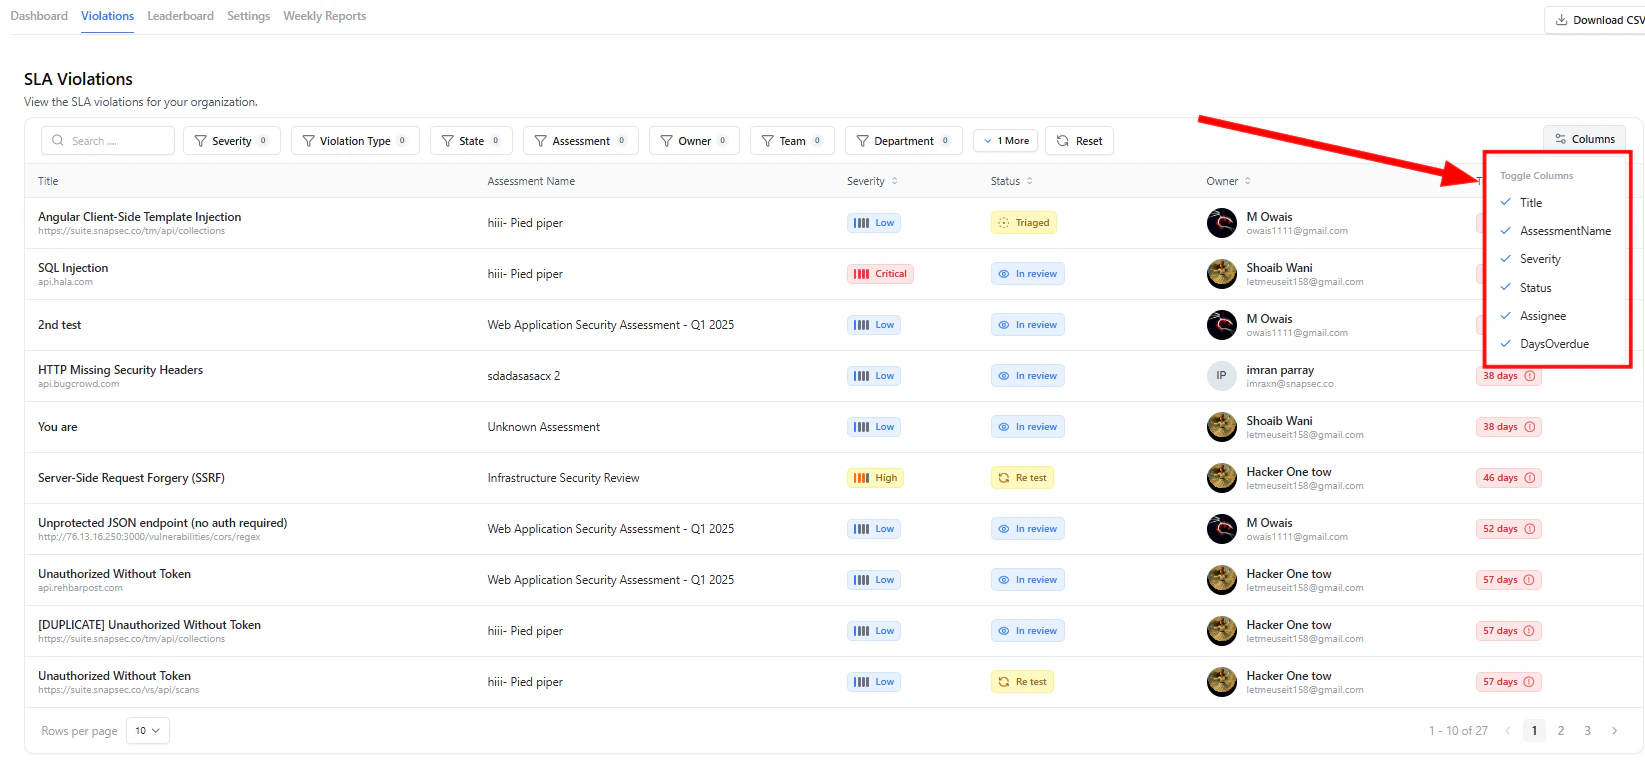
What You See
- Vulnerability title and source
- Severity and current state
- Assigned owner
- Time overdue (in days)
Powerful Controls
-
Advanced Filters
- Filter by severity, violation type, state, owner, team, department, and more
-
Column Customization
- Toggle visible columns for tailored workflows
-
CSV Export
- Download filtered data for reporting or audits
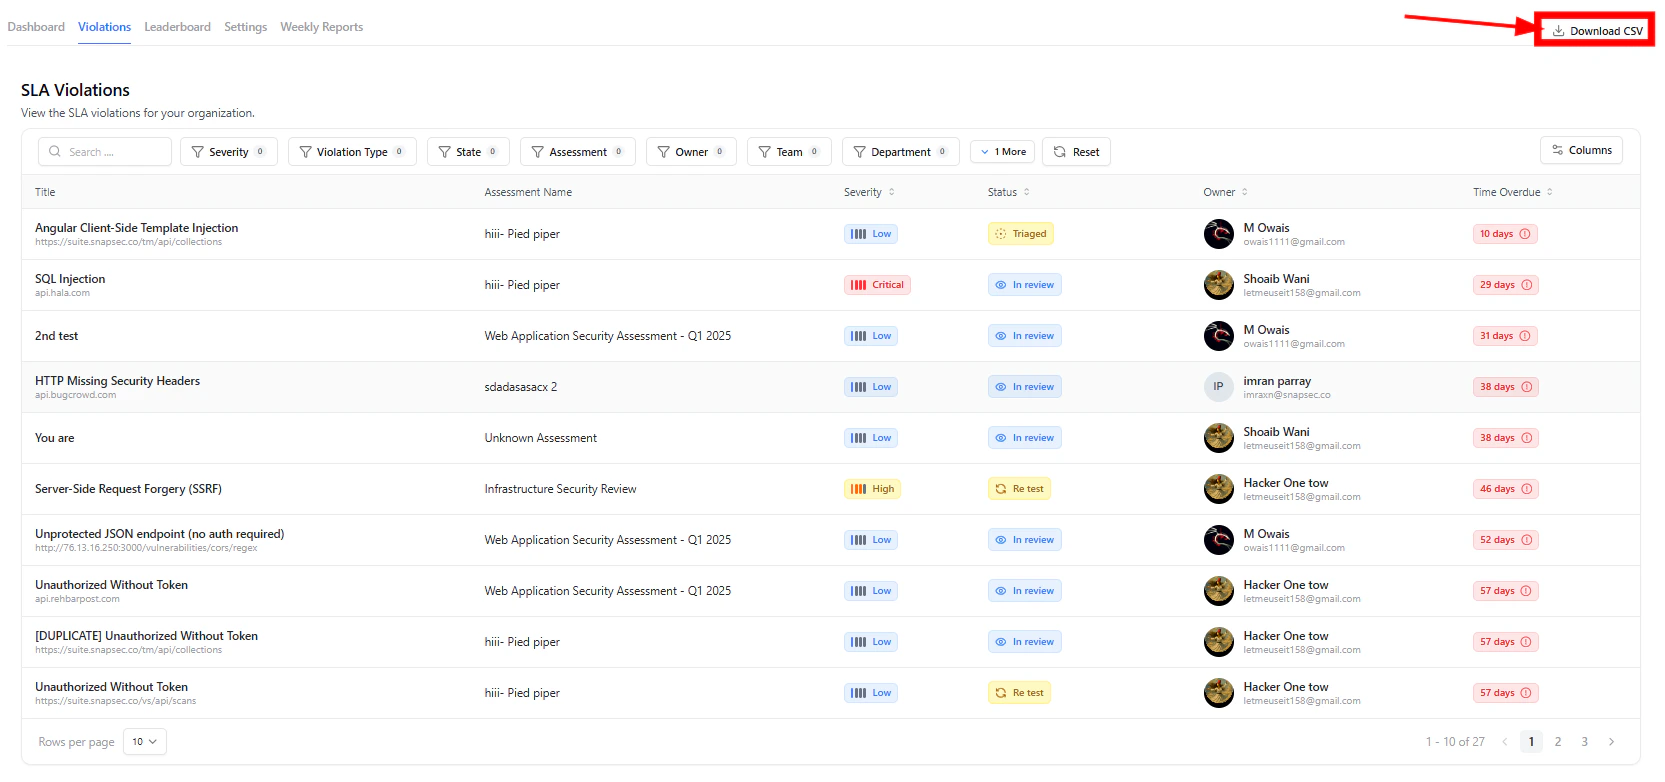
Focus instantly on critical SLA breaches using filters — no need to scan large datasets manually.
SLA Leaderboard
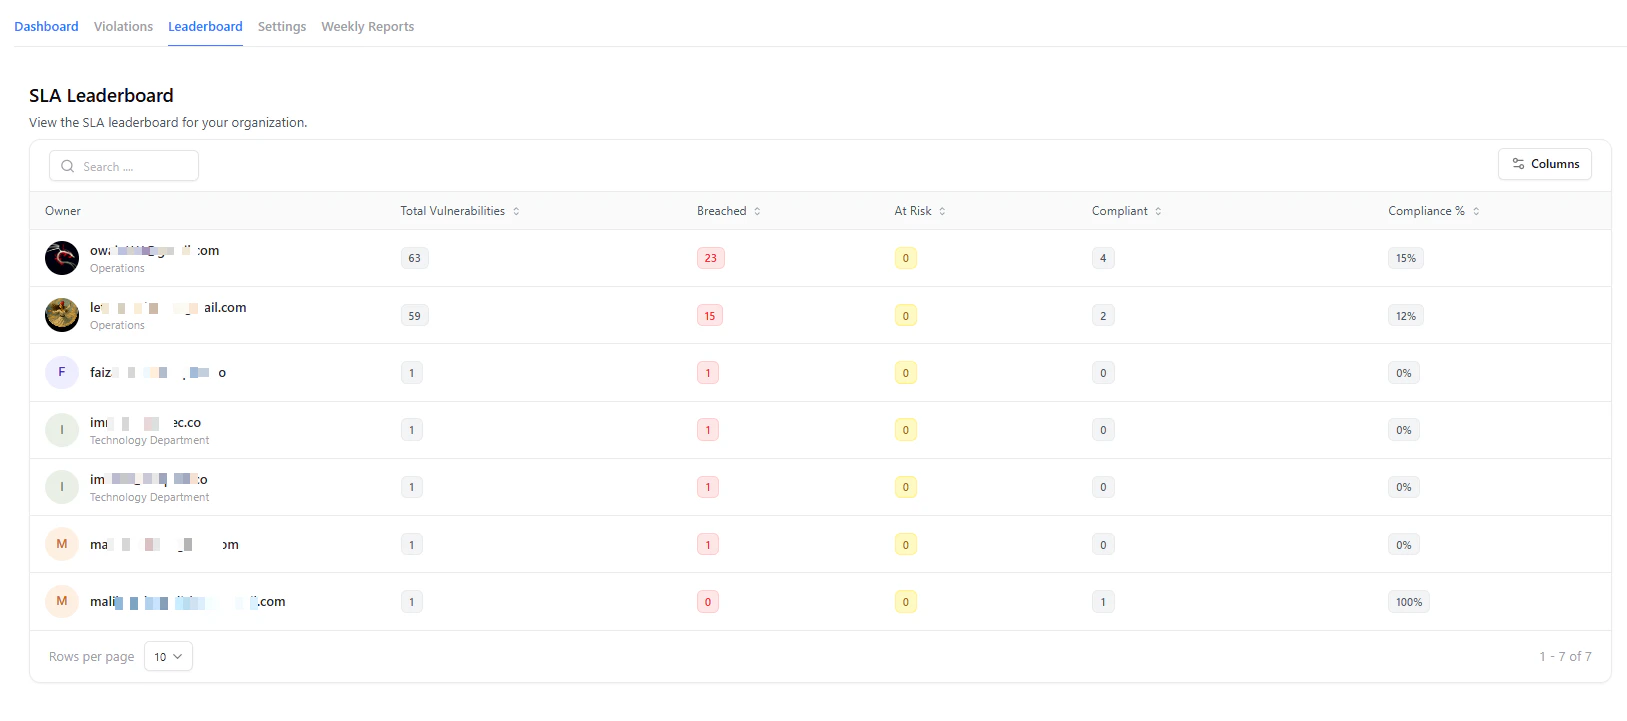
Metrics Tracked
- Total Vulnerabilities
- Breached
- At Risk
- Compliant
- Compliance %
- Identify high-performing teams
- Detect bottlenecks in remediation
- Drive accountability across owners
Turn SLA compliance into a measurable performance metric across teams.
SLA Configuration
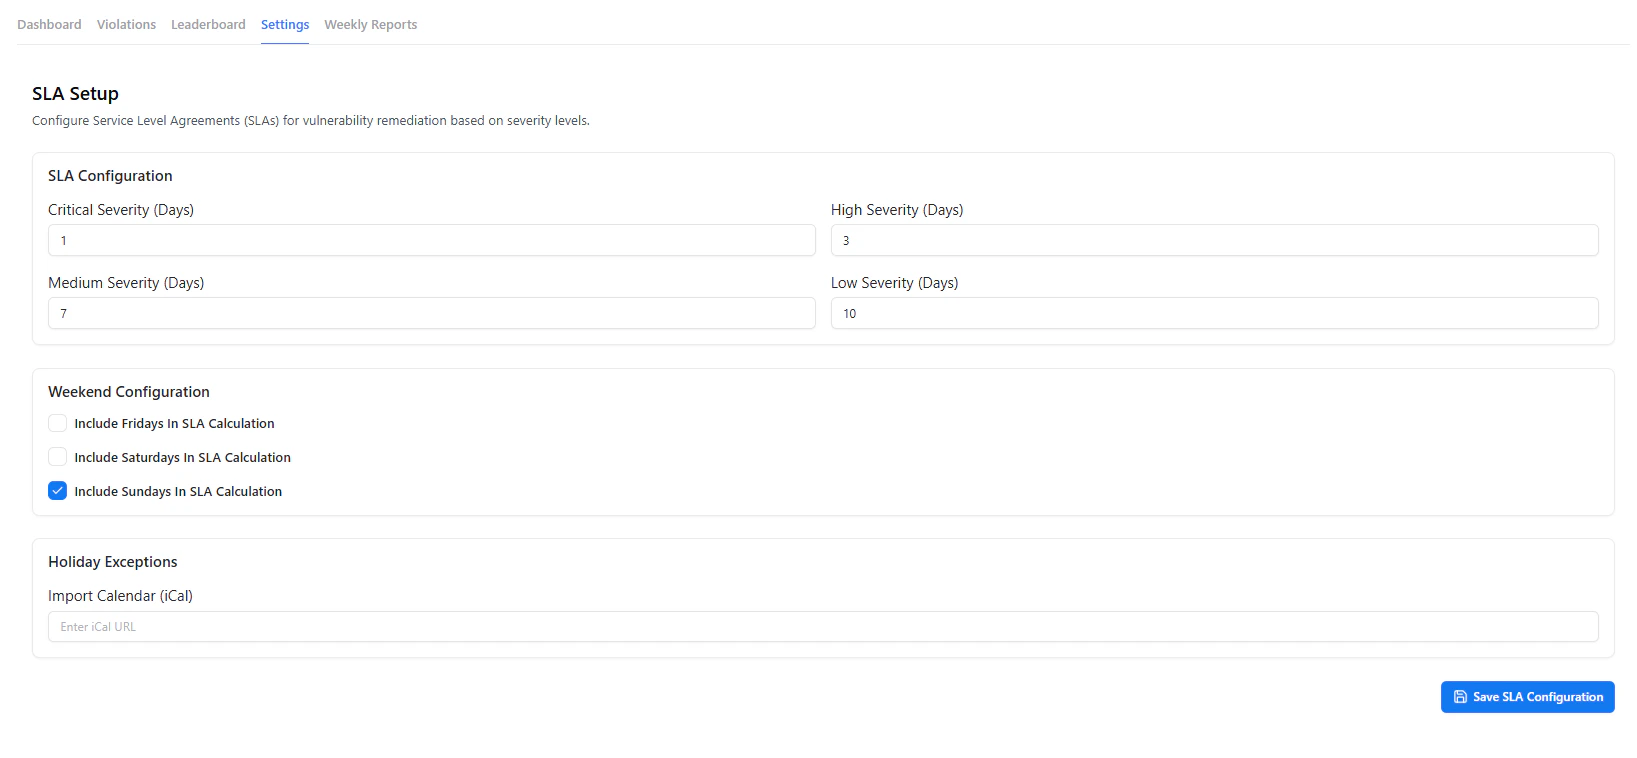
Configuration Options
-
Severity-Based Timelines
- Set resolution deadlines for Critical, High, Medium, and Low
-
Weekend Inclusion
- Include or exclude specific days in SLA calculations
-
Holiday Exceptions
- Import iCal calendars to exclude non-working days
Weekly Reports
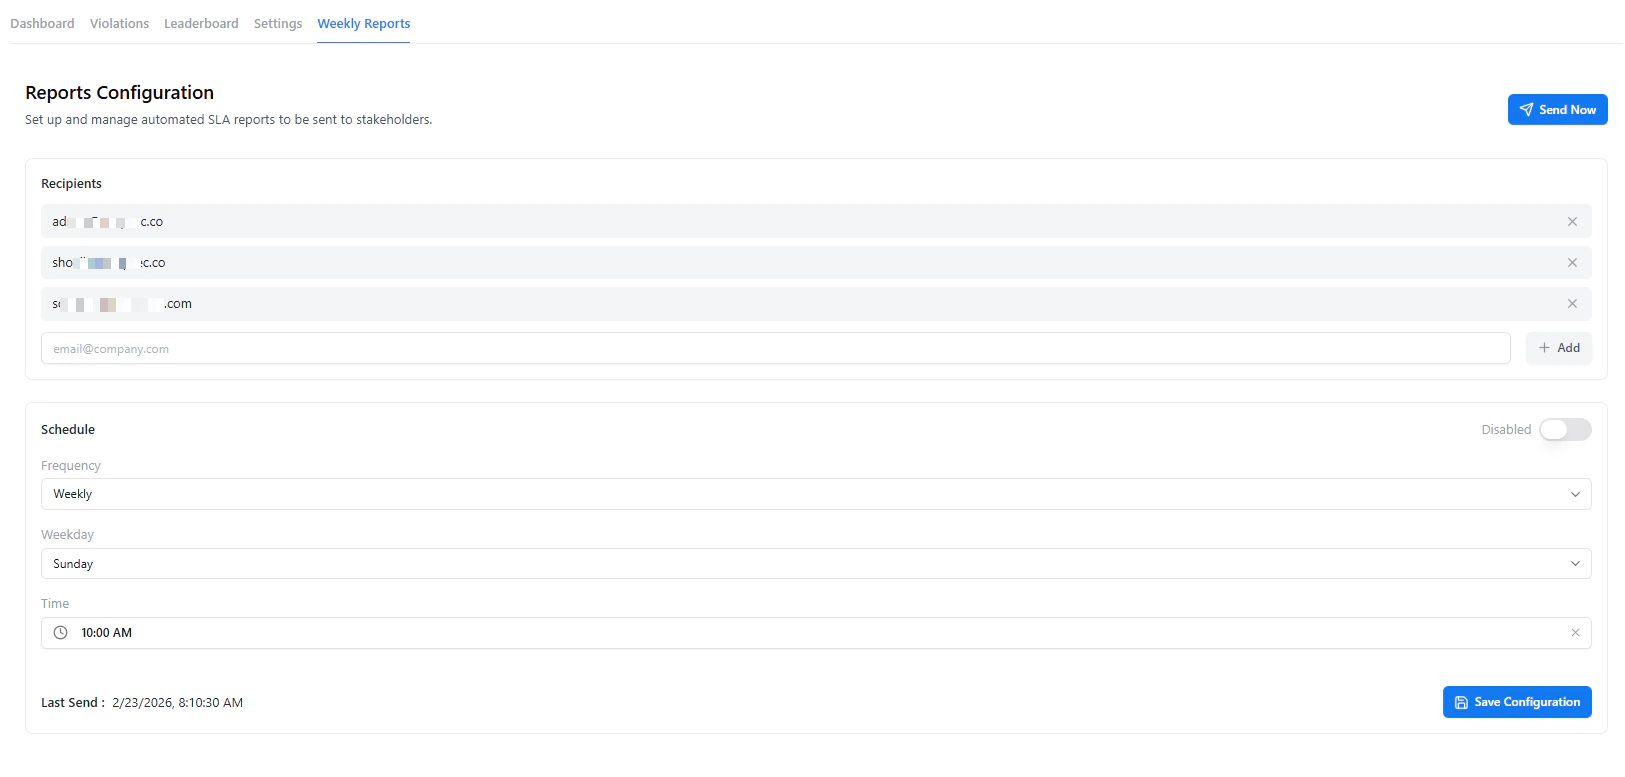
Features
-
Recipient Management
- Add multiple stakeholders
-
Flexible Scheduling
- Weekly frequency, day, and time selection
-
Manual Trigger
- Use Send Now for instant reporting
What Reports Include
- SLA compliance percentage
- Breached and at-risk vulnerabilities
- Severity breakdown
- Overall remediation performance
Keep leadership aligned with automated, consistent SLA reporting — no manual effort required.
Exporting Reports
You can export SLA insights at any time for audits or executive reporting.Exported reports include organization-wide SLA metrics, breakdowns, and performance indicators.
Why SLA Analytics Matters
SLA Analytics helps organizations:- Prevent SLA breaches before they happen
- Improve remediation speed and efficiency
- Align security and engineering teams
- Provide audit-ready compliance visibility
- Eliminate manual tracking and reporting
Explore Live Demo
Explore VM Live — No Signup Needed
Experience real-time SLA tracking, violation management, and automated reporting — all in one unified platform.