Overview
The Applications module provides a centralized inventory of all applications discovered across your environment — including internal services and externally exposed platforms. It enables teams to track ownership, understand deployment types, and monitor application lifecycle and security posture.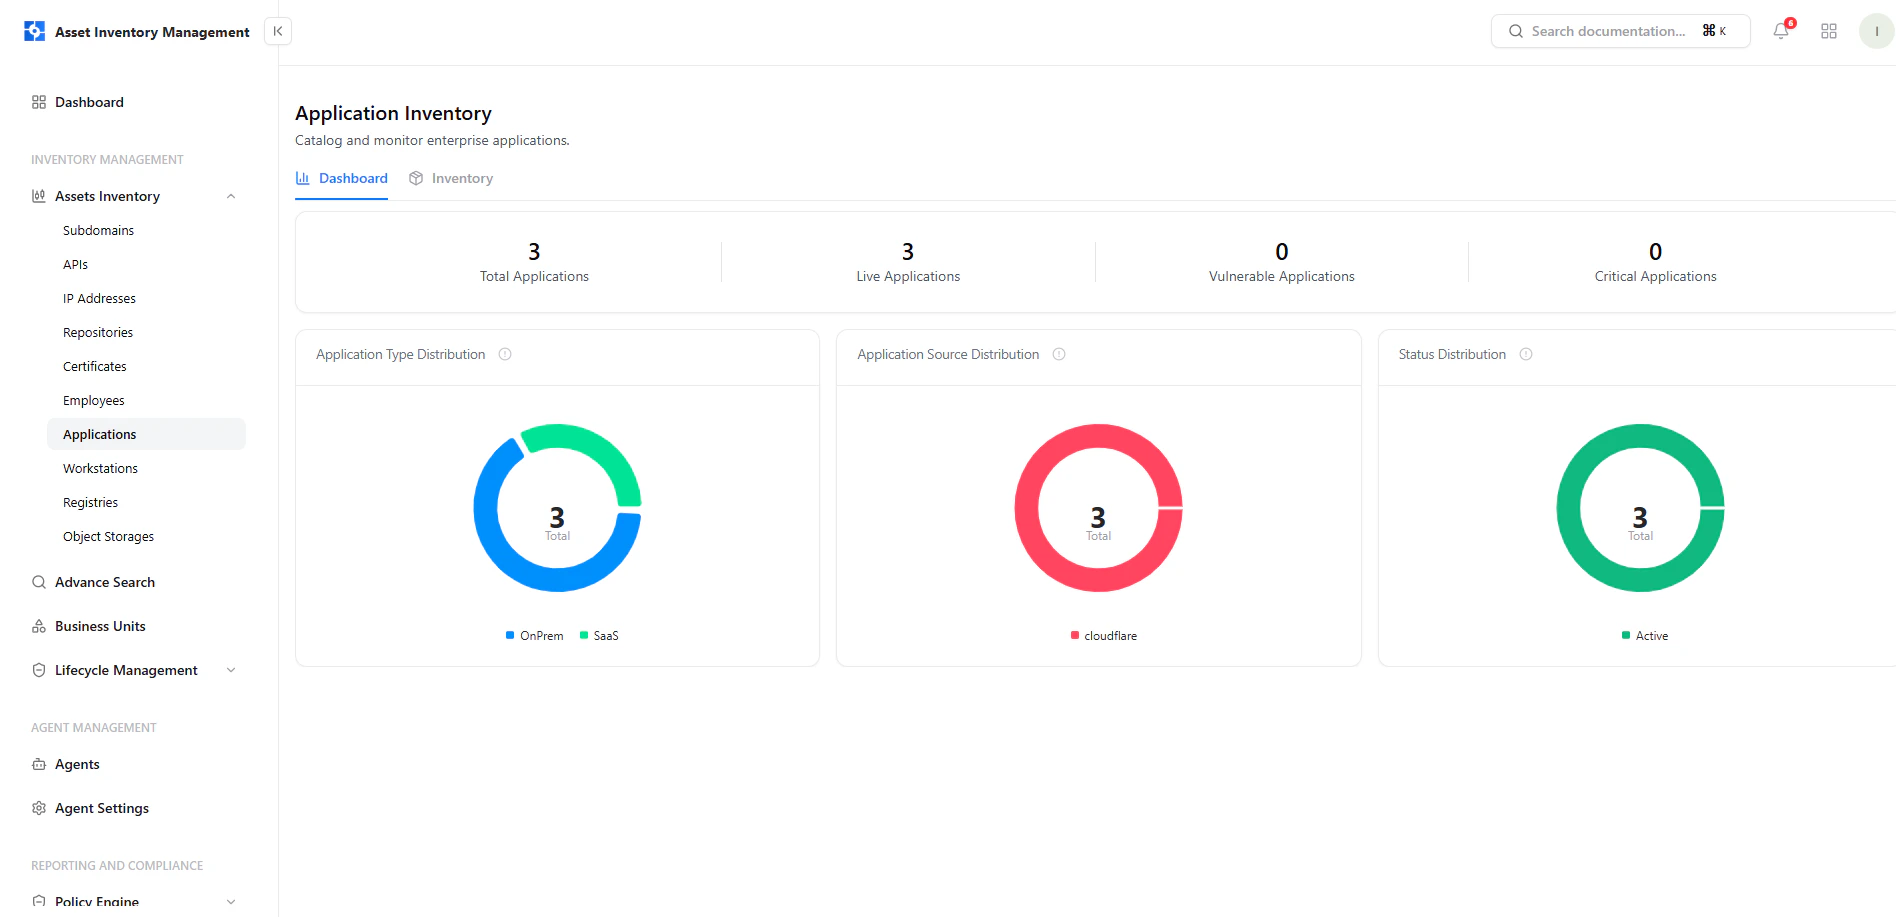
Dashboard View
The dashboard gives a high-level overview of your application landscape.Key Metrics
- Total Applications — All discovered applications
- Live Applications — Currently active applications
- Vulnerable Applications — Applications with detected issues
- Critical Applications — Applications with critical findings
Visual Insights
- Application Type Distribution — OnPrem vs SaaS
- Application Source Distribution — Discovery source (e.g., Cloudflare)
- Status Distribution — Lifecycle state of applications
Application Inventory
The inventory view lists all applications with operational and ownership details.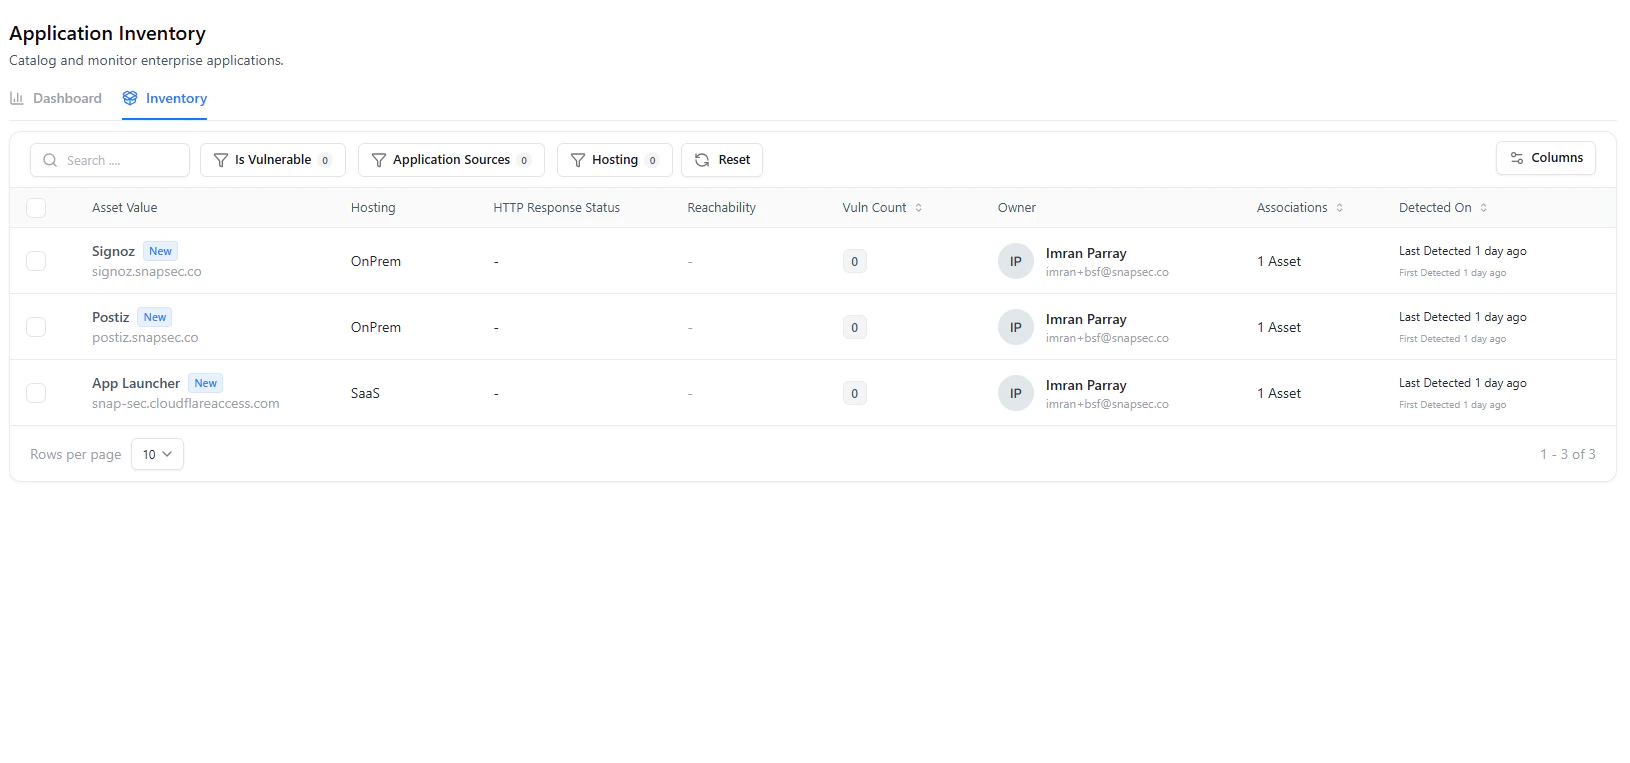
Table Columns
| Column | Description |
|---|---|
| Asset Value | Application name and domain |
| Hosting | Deployment type (OnPrem / SaaS) |
| HTTP Response Status | Response status (if available) |
| Reachability | External/Internal visibility |
| Vuln Count | Number of linked vulnerabilities |
| Owner | Assigned owner |
| Associations | Linked assets |
| Detected On | Discovery timeline |
Filters & Search
- Is Vulnerable
- Application Sources
- Hosting Type
- Search by application name
Application Asset View
Selecting an application opens a detailed view with complete context.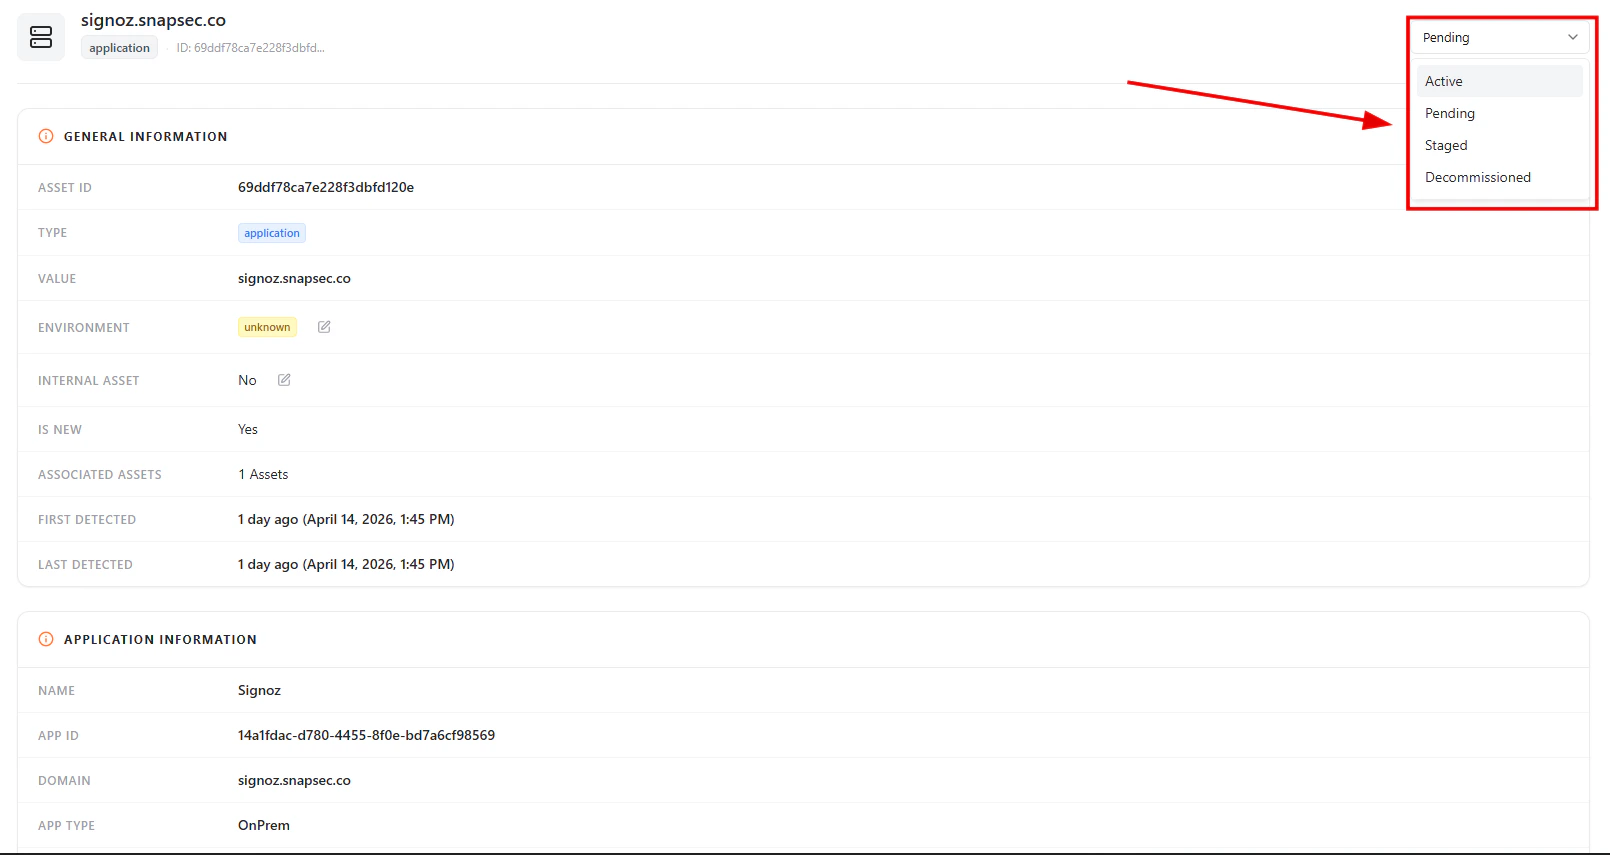
General Information
Each application includes:- Asset ID
- Type (Application)
- Value (Domain / Identifier)
- Environment
- Internal Asset (Yes / No)
- Associated Assets
- First Detected / Last Detected
Lifecycle Status
Applications support lifecycle tracking directly from the asset view.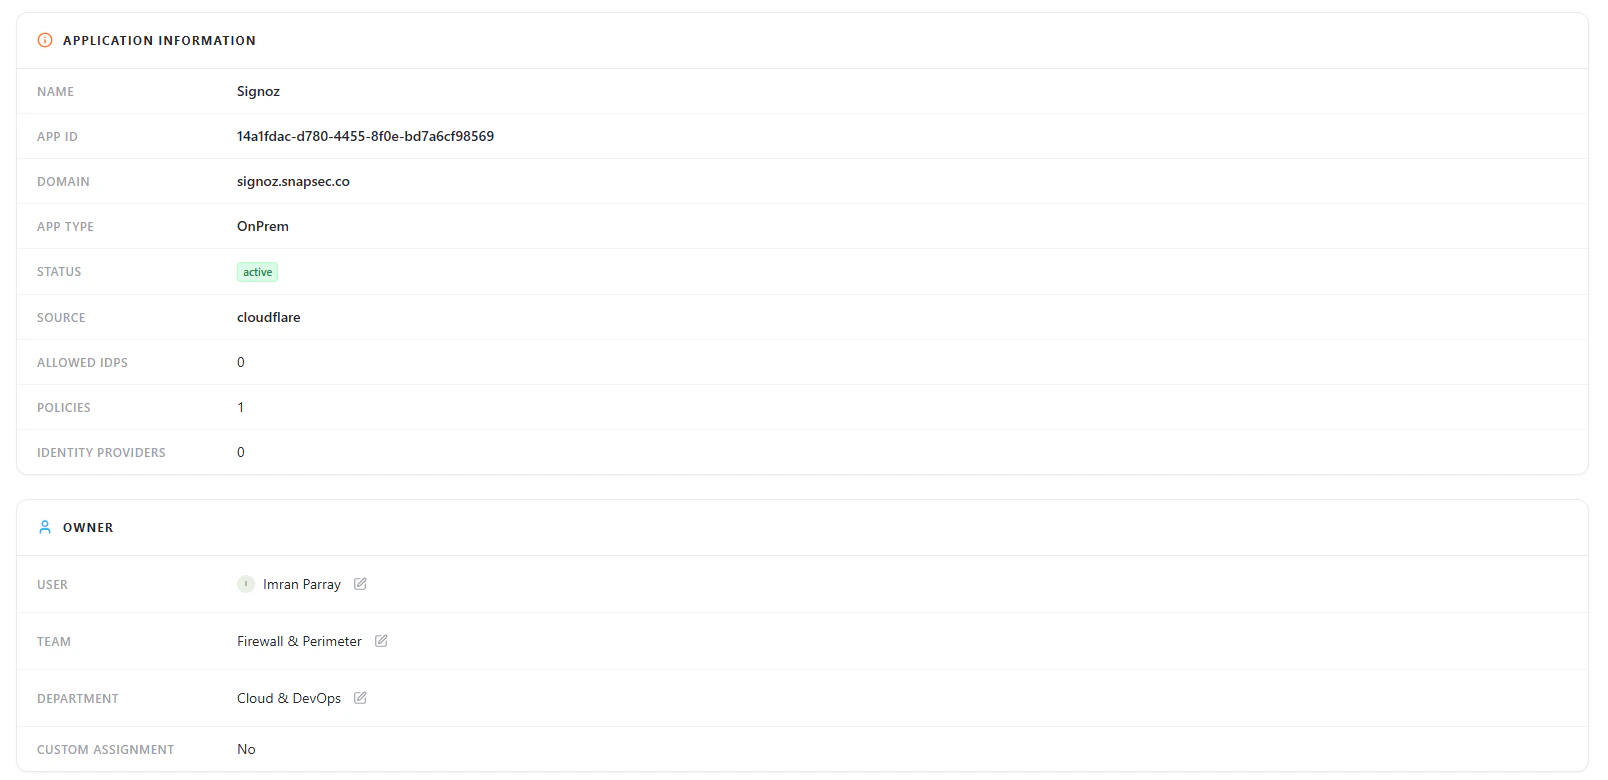
- Active — Currently in use
- Pending — Newly discovered and under review
- Staged — Pre-production or testing phase
- Decommissioned — No longer in use
Application Information
- Application Name
- App ID
- Domain
- Application Type (OnPrem / SaaS)
- Status
- Source (e.g., Cloudflare)
- Allowed IPs
- Policies
- Identity Providers
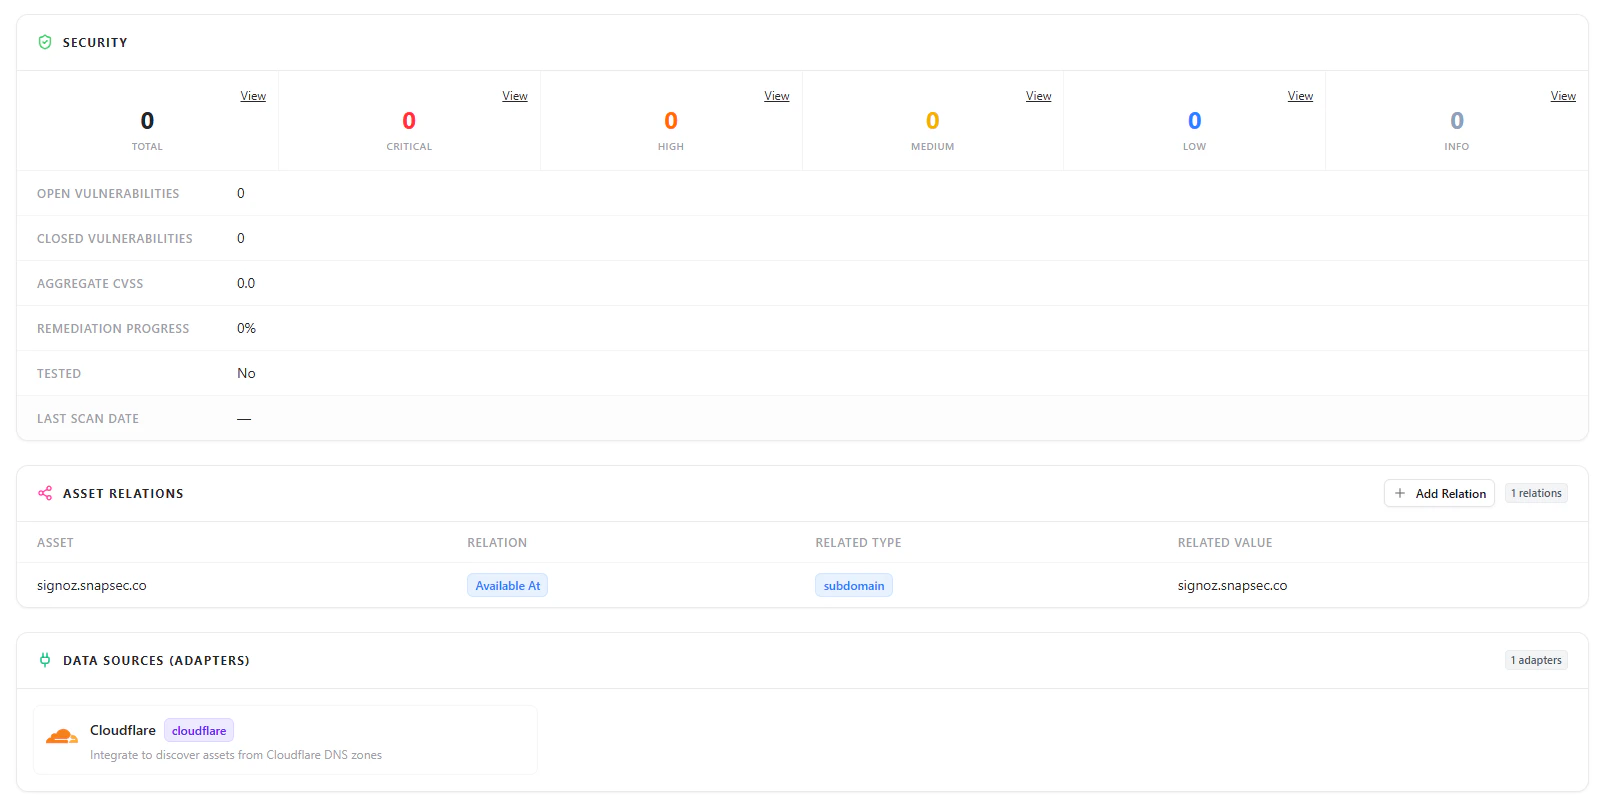
Security Overview
- Total vulnerabilities
- Severity breakdown (Critical, High, Medium, Low, Info)
- Open vs closed vulnerabilities
- Aggregate CVSS score
- Remediation progress
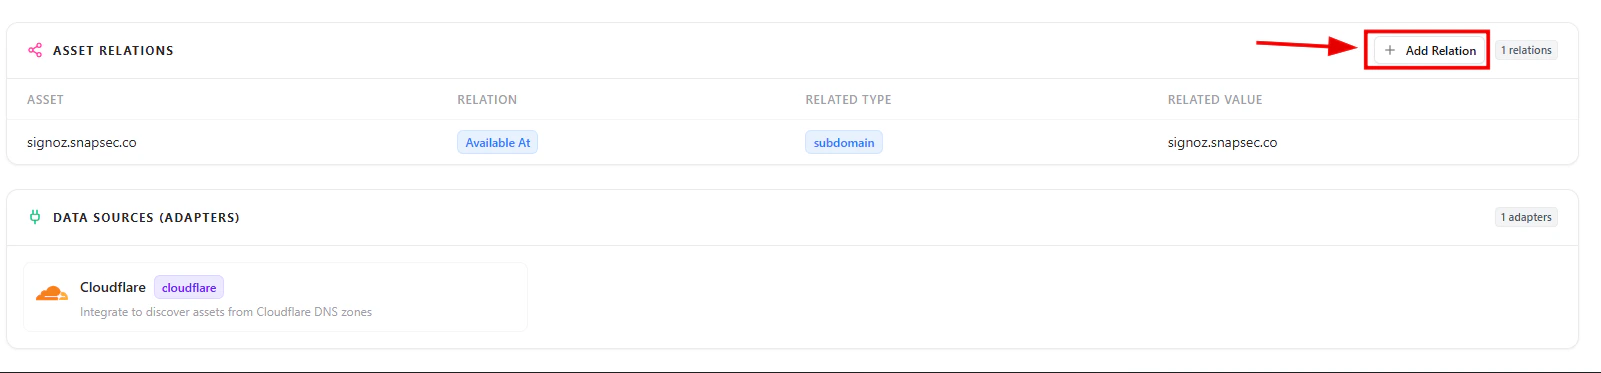
Asset Relationships
Applications are connected to other assets within your environment.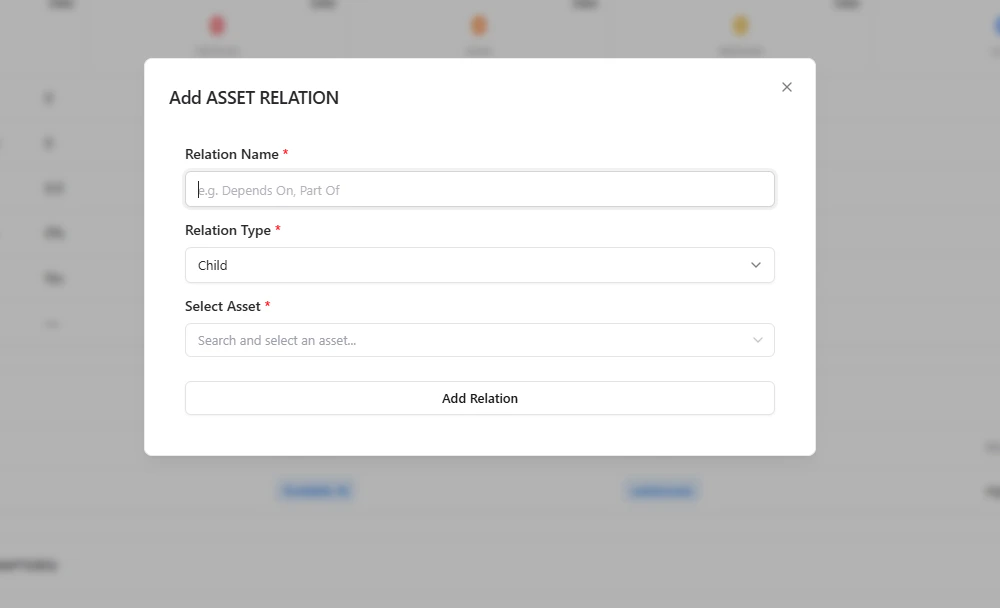
- Understand how applications are linked to subdomains and other assets
- Identify dependencies across the environment
- Analyze impact before making changes
Data Sources (Adapters)
Applications are discovered through integrated data sources.- Example: Cloudflare
- Shows which integrations are contributing asset discovery
Why This Matters
The Applications module helps teams:- Maintain a complete application inventory
- Track ownership and accountability
- Understand deployment environments (OnPrem vs SaaS)
- Monitor lifecycle states of applications
- Identify security issues across applications
- Gain visibility into asset relationships
Explore Live Demo
Explore AIM Live — No Signup Needed
Instantly explore how Snapsec AIM discovers, enriches, and tracks applications across your organization — all without creating an account.