

Risk Analytics
Overview
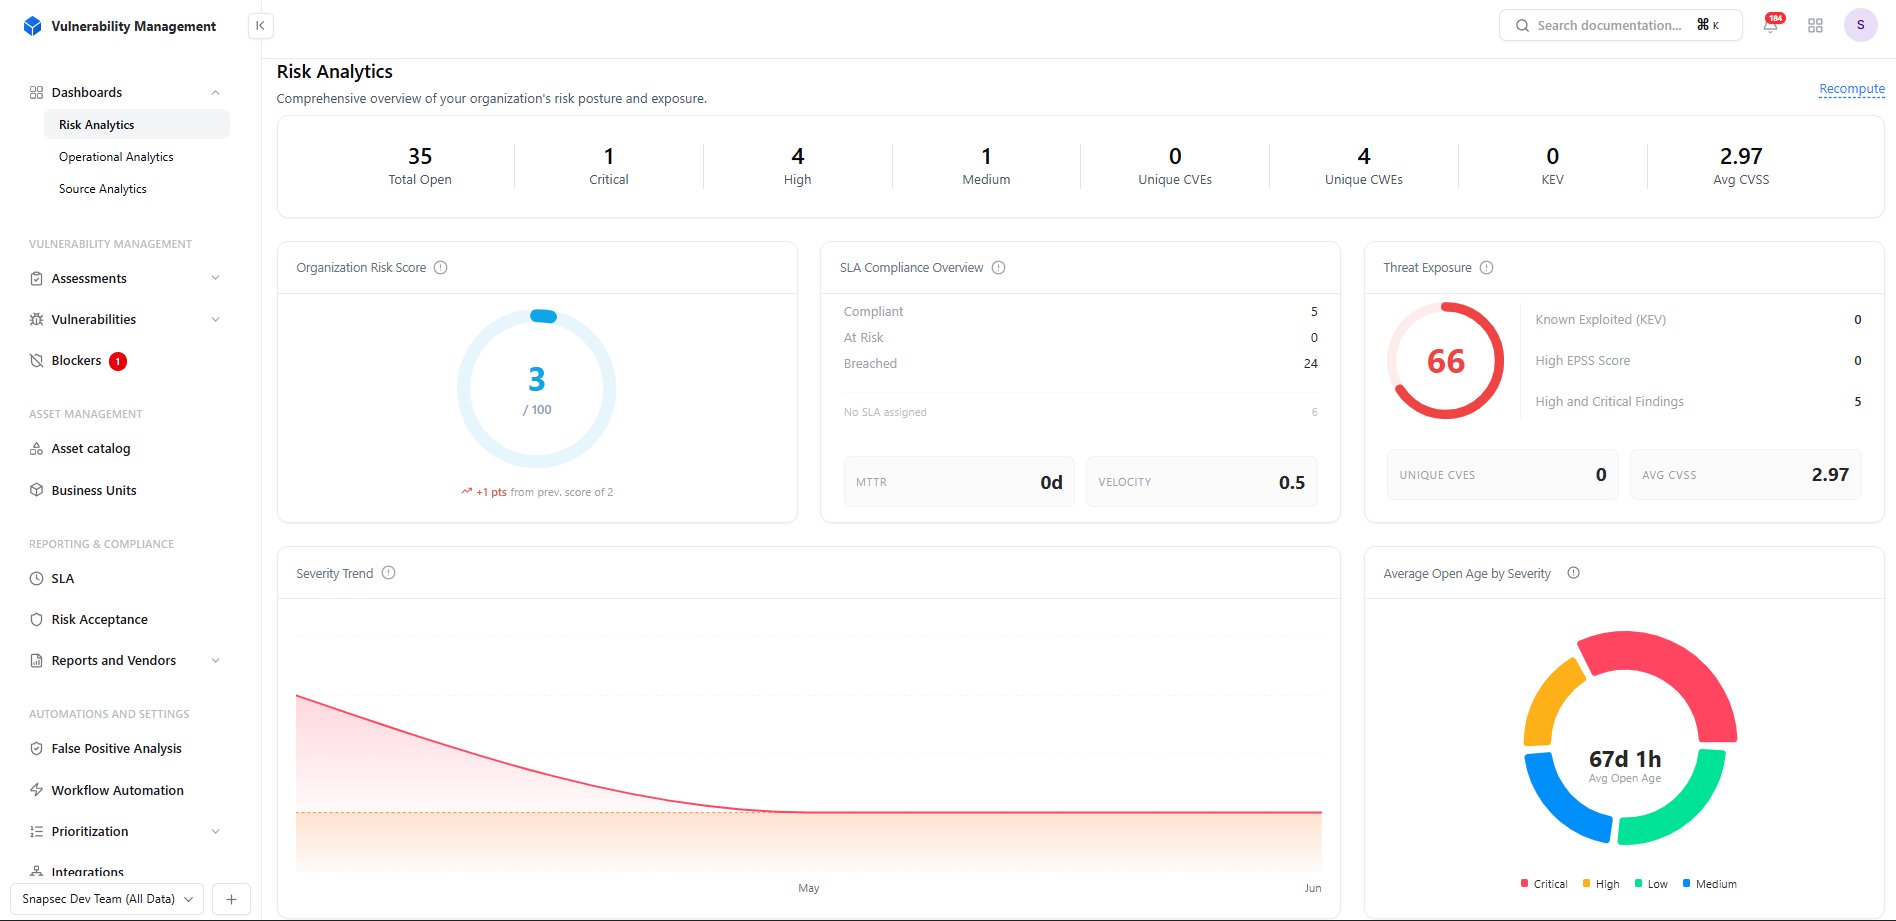
Risk Analytics dashboard providing a high-level overview of organizational security posture
Executive Summary
The summary cards at the top of the dashboard provide an instant snapshot of your current vulnerability landscape.Available Metrics
- Total Open
- Displays the total number of unresolved vulnerabilities.
- Critical
- Number of active Critical severity vulnerabilities.
- High
- Number of High severity vulnerabilities.
- Medium
- Number of Medium severity vulnerabilities.
- Unique CVEs
- Total unique CVEs currently affecting your environment.
- Unique CWEs
- Number of unique weakness categories represented across findings.
- Known Exploited Vulnerabilities (KEV)
- Vulnerabilities listed in the CISA Known Exploited Vulnerabilities catalog.
- Average CVSS
- Average CVSS score across all active findings.
Organization Risk Score
The Organization Risk Score provides an overall measurement of your security posture. The score is dynamically calculated using multiple factors including:- Vulnerability severity
- True Risk prioritization
- Business impact
- Asset exposure
- Active vulnerabilities
- Organizational risk weighting
SLA Compliance Overview
The SLA Compliance widget tracks remediation performance against defined Service Level Agreements. It provides visibility into:- Compliant vulnerabilities
- At Risk vulnerabilities
- Breached vulnerabilities
- Vulnerabilities without assigned SLAs
- MTTR (Mean Time to Resolution)
- Remediation Velocity
Threat Exposure
The Threat Exposure panel summarizes your organization’s exposure based on multiple security indicators. Key metrics include:- Overall Exposure Score
- Known Exploited Vulnerabilities (KEV)
- High EPSS vulnerabilities
- High and Critical findings
- Average CVSS
- Unique CVEs
Severity Trend
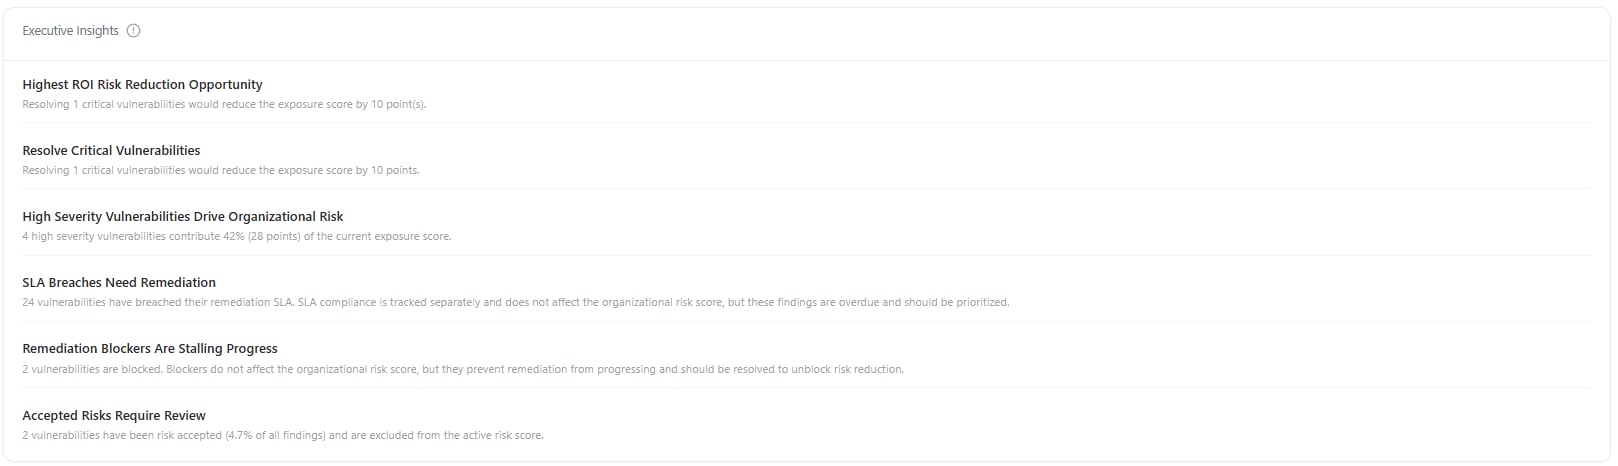
Historical severity trend showing changes in organizational risk over time
- New vulnerabilities introduced
- Reduction through remediation
- Overall security posture improvements
- Historical remediation progress
Average Open Age
The Average Open Age by Severity visualization shows how long vulnerabilities remain unresolved across each severity level. This helps identify:- Aging Critical vulnerabilities
- Long-standing High severity findings
- Medium and Low severity backlog
- Overall remediation efficiency
Executive Insights
The Executive Insights panel automatically highlights the most important remediation opportunities and security observations. Typical recommendations include:- Critical vulnerabilities with the highest impact
- High severity findings driving organizational risk
- SLA breaches requiring immediate attention
- Remediation blockers delaying progress
- Accepted risks that should be periodically reviewed
Why Risk Analytics Matters
Risk Analytics transforms vulnerability data into actionable security intelligence by helping organizations:- Understand overall organizational risk
- Monitor remediation performance
- Track SLA compliance
- Measure threat exposure
- Prioritize vulnerabilities effectively
- Present executive-ready security metrics
Operational Analytics
Overview
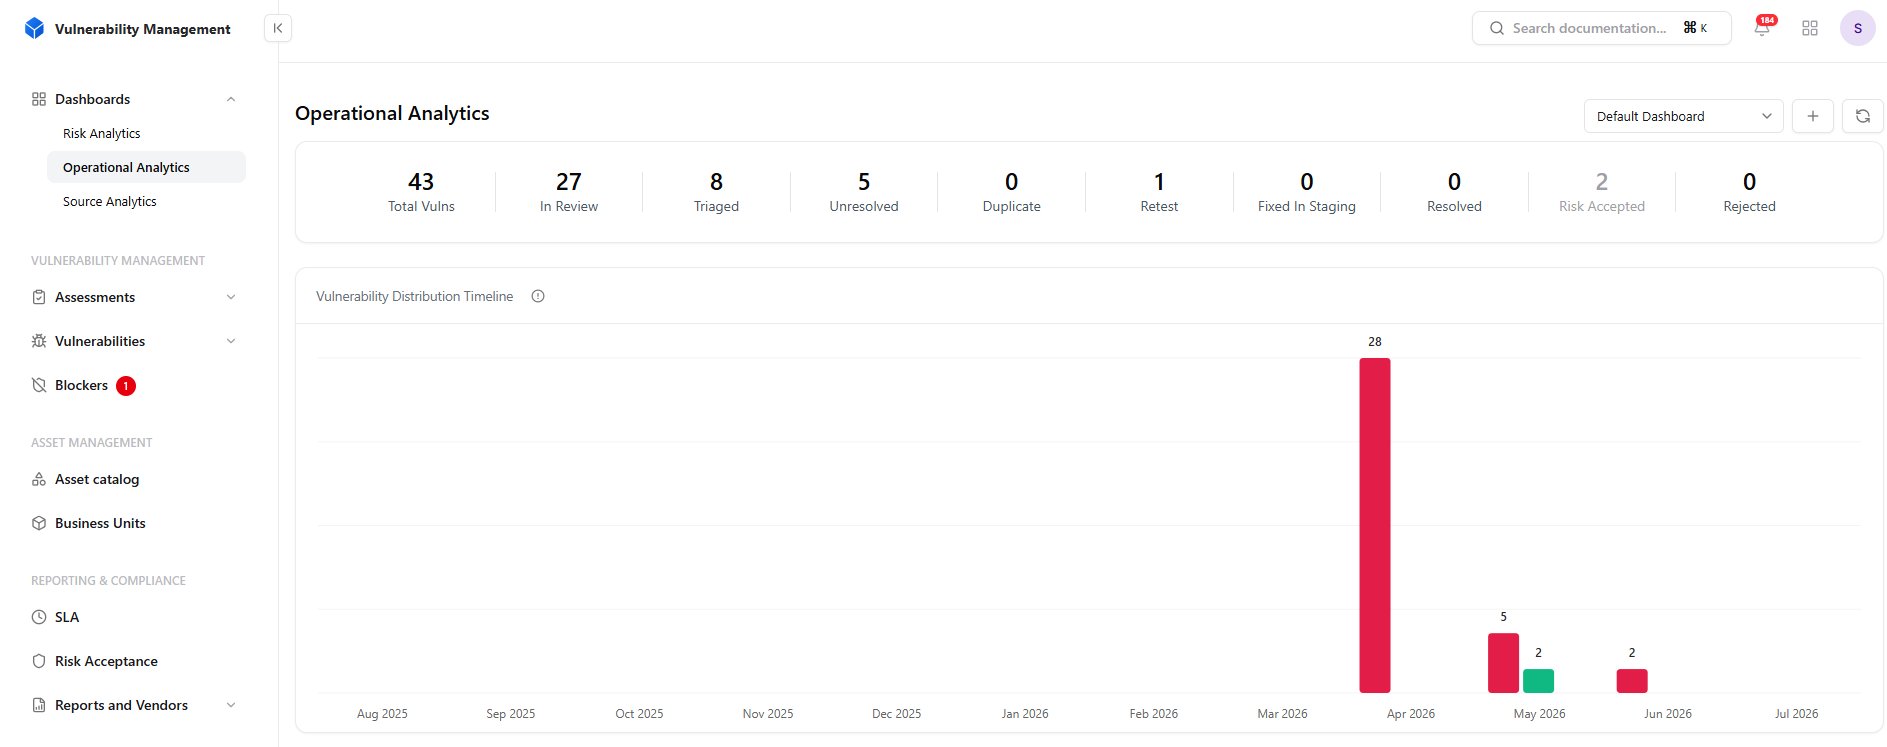
Operational Analytics dashboard showing remediation progress, team performance, and vulnerability lifecycle metrics
Operational Summary
The summary section provides an instant overview of vulnerability lifecycle states.Available Metrics
- Total Vulnerabilities
- Total vulnerabilities currently tracked.
- In Review
- Findings awaiting triage.
- Triaged
- Vulnerabilities that have been reviewed and categorized.
- Unresolved
- Open vulnerabilities still awaiting remediation.
- Duplicate
- Duplicate findings linked to existing vulnerabilities.
- Retest
- Vulnerabilities awaiting verification after remediation.
- Fixed in Staging
- Vulnerabilities resolved in staging environments and awaiting production validation.
- Resolved
- Successfully remediated vulnerabilities.
- Risk Accepted
- Vulnerabilities accepted by the organization after risk assessment.
- Rejected
- Findings determined to be invalid or not applicable.
Vulnerability Discovery Timeline
The timeline visualizes how vulnerabilities are discovered over time, helping teams identify spikes in findings and monitor remediation trends. This visualization assists with:- Monitoring assessment activity
- Identifying unusual increases in findings
- Measuring remediation progress
- Understanding long-term security trends
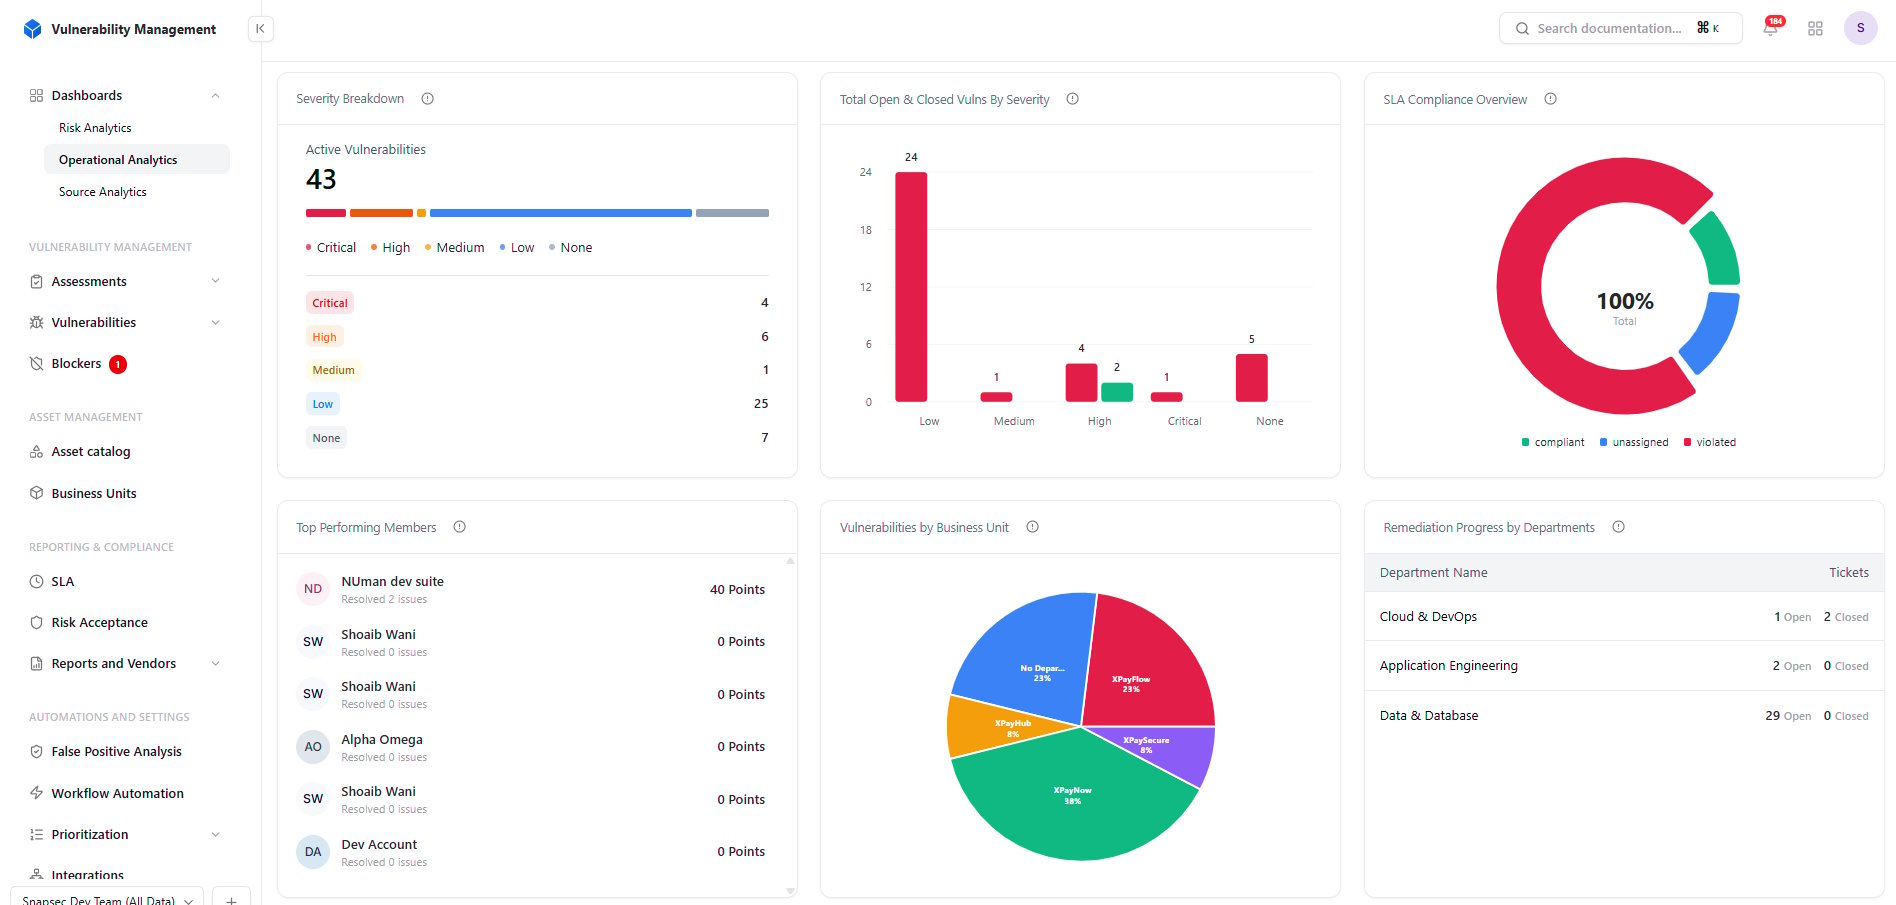
Operational Analytics widgets showing remediation performance and security operations
Operational Widgets
The dashboard includes several widgets that provide detailed operational insights.Severity Distribution
Displays the distribution of vulnerabilities across:- Critical
- High
- Medium
- Low
- Informational
Open vs Closed by Severity
Compares resolved and unresolved vulnerabilities across each severity level. This enables teams to quickly determine whether high-risk vulnerabilities are being remediated effectively.SLA Compliance
Measures remediation performance against defined Service Level Agreements. Displays:- Within SLA
- At Risk
- Breached
- No SLA Assigned
Top Performing Members
Ranks team members based on remediation activity and vulnerability closures. This provides visibility into:- Individual contributions
- Team productivity
- Workload distribution
Vulnerabilities by Business Unit
Displays how vulnerabilities are distributed across different business units. This helps organizations identify departments requiring additional security attention.Remediation by Department
Measures remediation performance across organizational departments. Useful for identifying:- Teams resolving vulnerabilities quickly
- Departments with growing remediation backlogs
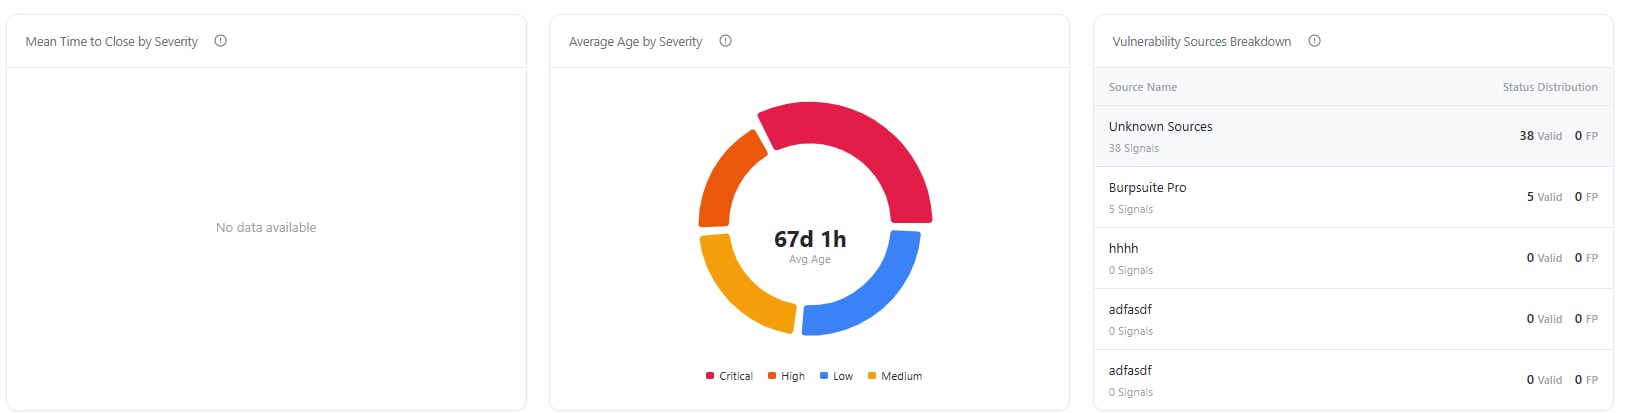
Additional operational metrics including MTTC, vulnerability aging, and source analysis
Advanced Operational Metrics
Operational Analytics also includes advanced measurements for tracking remediation efficiency.Mean Time to Close (MTTC)
Measures the average time required to resolve vulnerabilities. This KPI helps evaluate overall remediation effectiveness.Average Vulnerability Age
Displays the average age of unresolved vulnerabilities grouped by severity. Older vulnerabilities often indicate remediation bottlenecks or resource constraints.Vulnerability Source Distribution
Shows where vulnerabilities originate. Examples include:- Qualys
- Nuclei
- Trivy
- Manual Assessments
- Other integrated scanners
Custom Dashboards
Operational Analytics supports creating multiple custom dashboards for different teams, projects, or reporting requirements.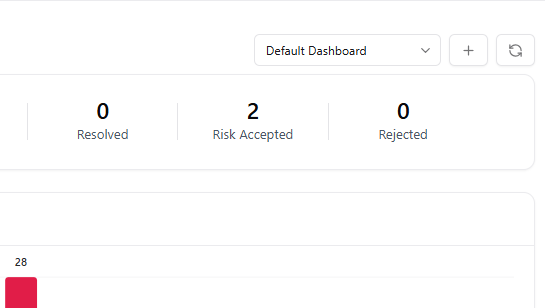
Create a new operational dashboard
- Click the + button beside the dashboard selector.
- Enter a dashboard name.
- Provide an optional description.
- Select related assessments.
- Choose dashboard visibility.
- Save the dashboard.
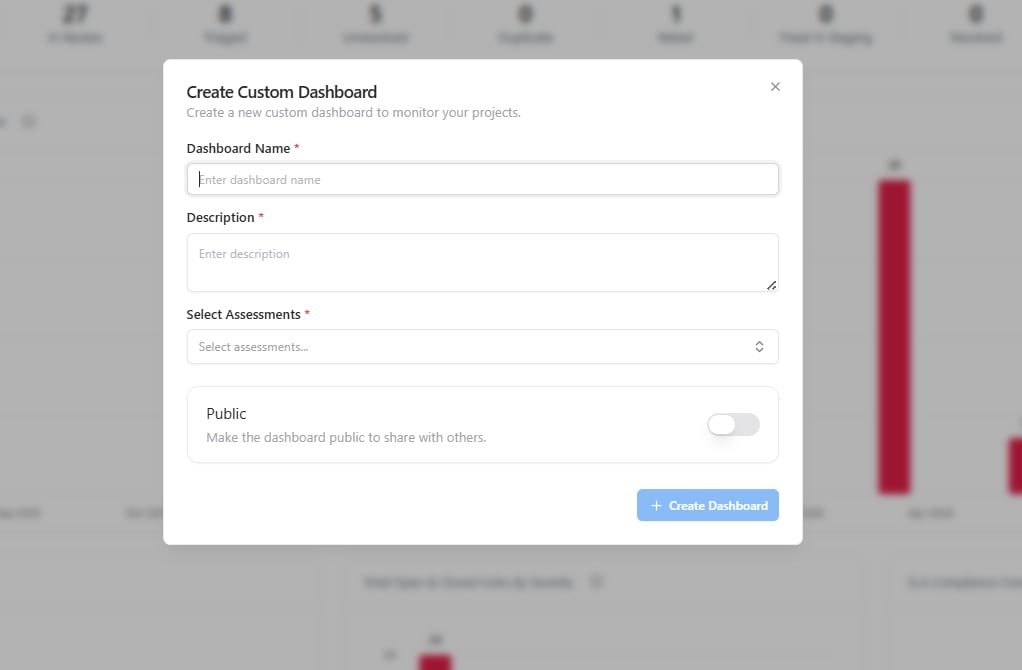
Configure dashboard information and linked assessments
Dashboard Configuration
Each dashboard can be customized with:- Dashboard Name
- Description
- Linked Assessments
- Public or Private Visibility
Why Operational Analytics Matters
Operational Analytics transforms remediation activities into measurable operational metrics. It enables organizations to:- Monitor remediation progress
- Track SLA performance
- Measure team productivity
- Identify operational bottlenecks
- Improve remediation efficiency
- Build customized dashboards for different teams
Source Analytics
Overview
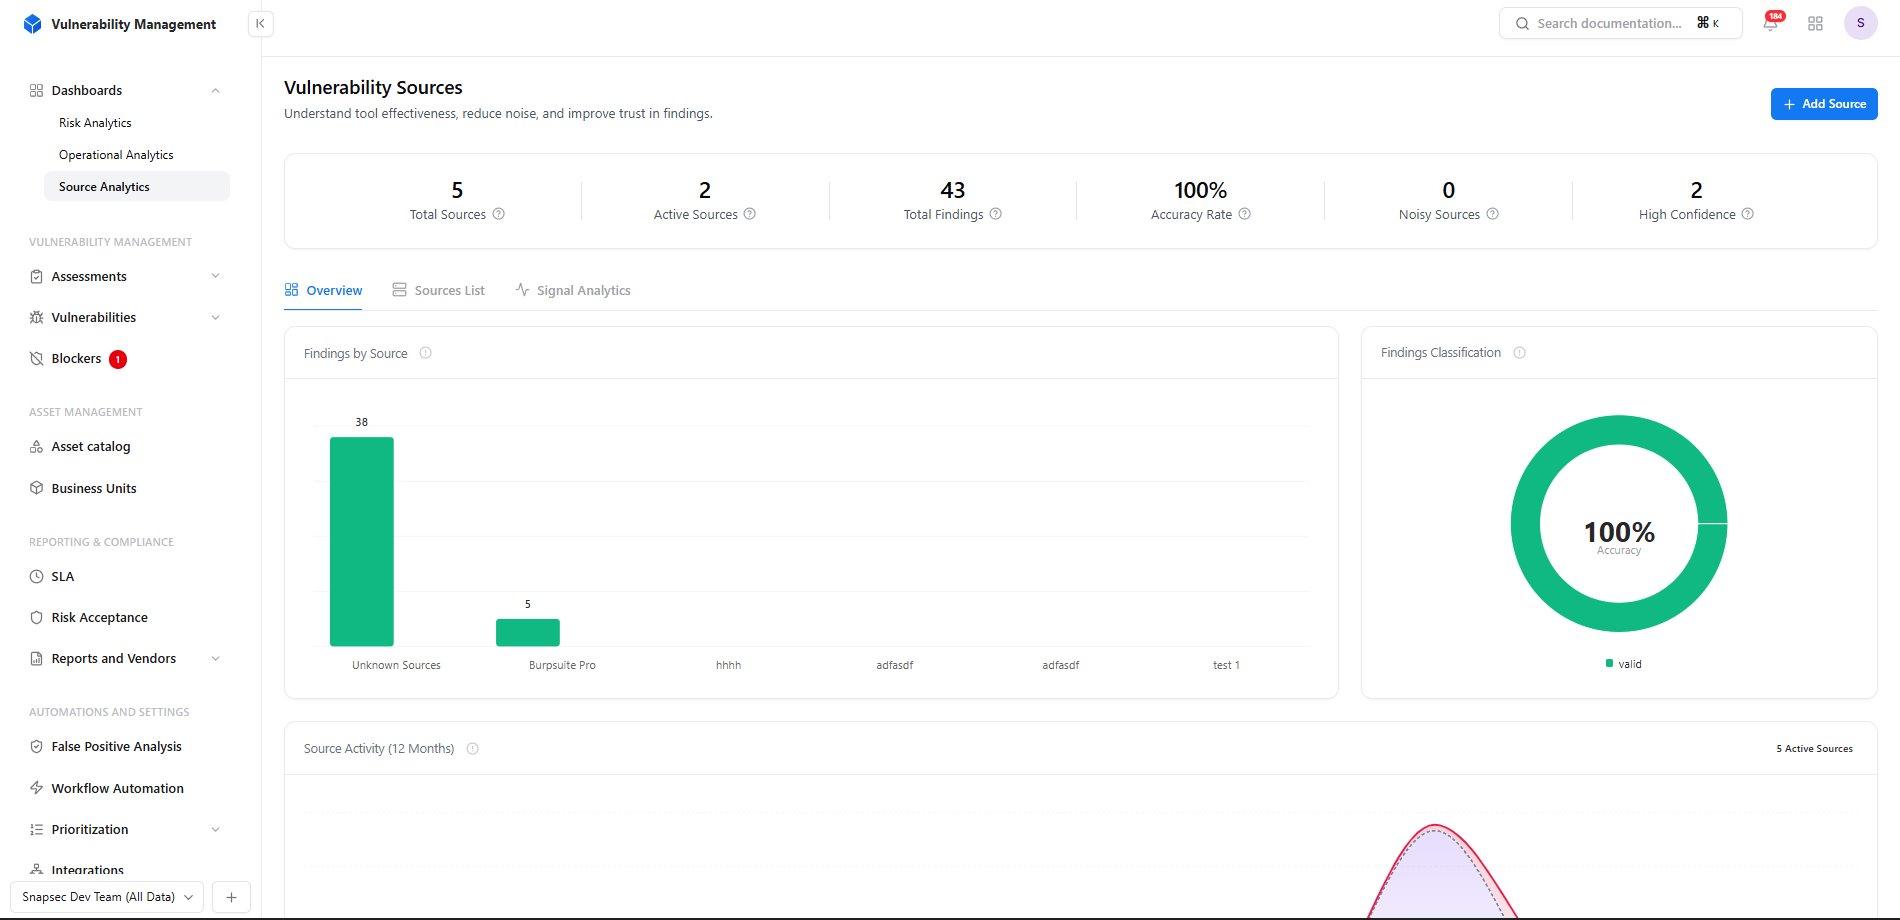
Source Analytics dashboard providing visibility into scanner performance and vulnerability source quality
Source Overview
The dashboard begins with a high-level summary of all registered vulnerability sources.Available Metrics
- Total Sources
- Total number of configured vulnerability sources.
- Active Sources
- Sources currently contributing findings.
- Total Findings
- Combined findings across all configured sources.
- Accuracy Rate
- Overall percentage of validated findings.
- Noisy Sources
- Sources generating excessive false positives.
- High Confidence Sources
- Sources consistently producing reliable findings.
Source Performance
The dashboard includes several visualizations that help evaluate scanner performance.Findings by Source
Displays how vulnerabilities are distributed across each integrated scanner or manual source. This helps identify:- Primary vulnerability producers
- Scanner utilization
- Assessment coverage
Findings Classification
Breaks down findings into categories such as:- Valid
- False Positive
- Risk Accepted
Source Activity
Visualizes source activity over time, showing how many findings each source contributes throughout the year. This enables organizations to monitor scanner usage and identify changes in vulnerability discovery patterns.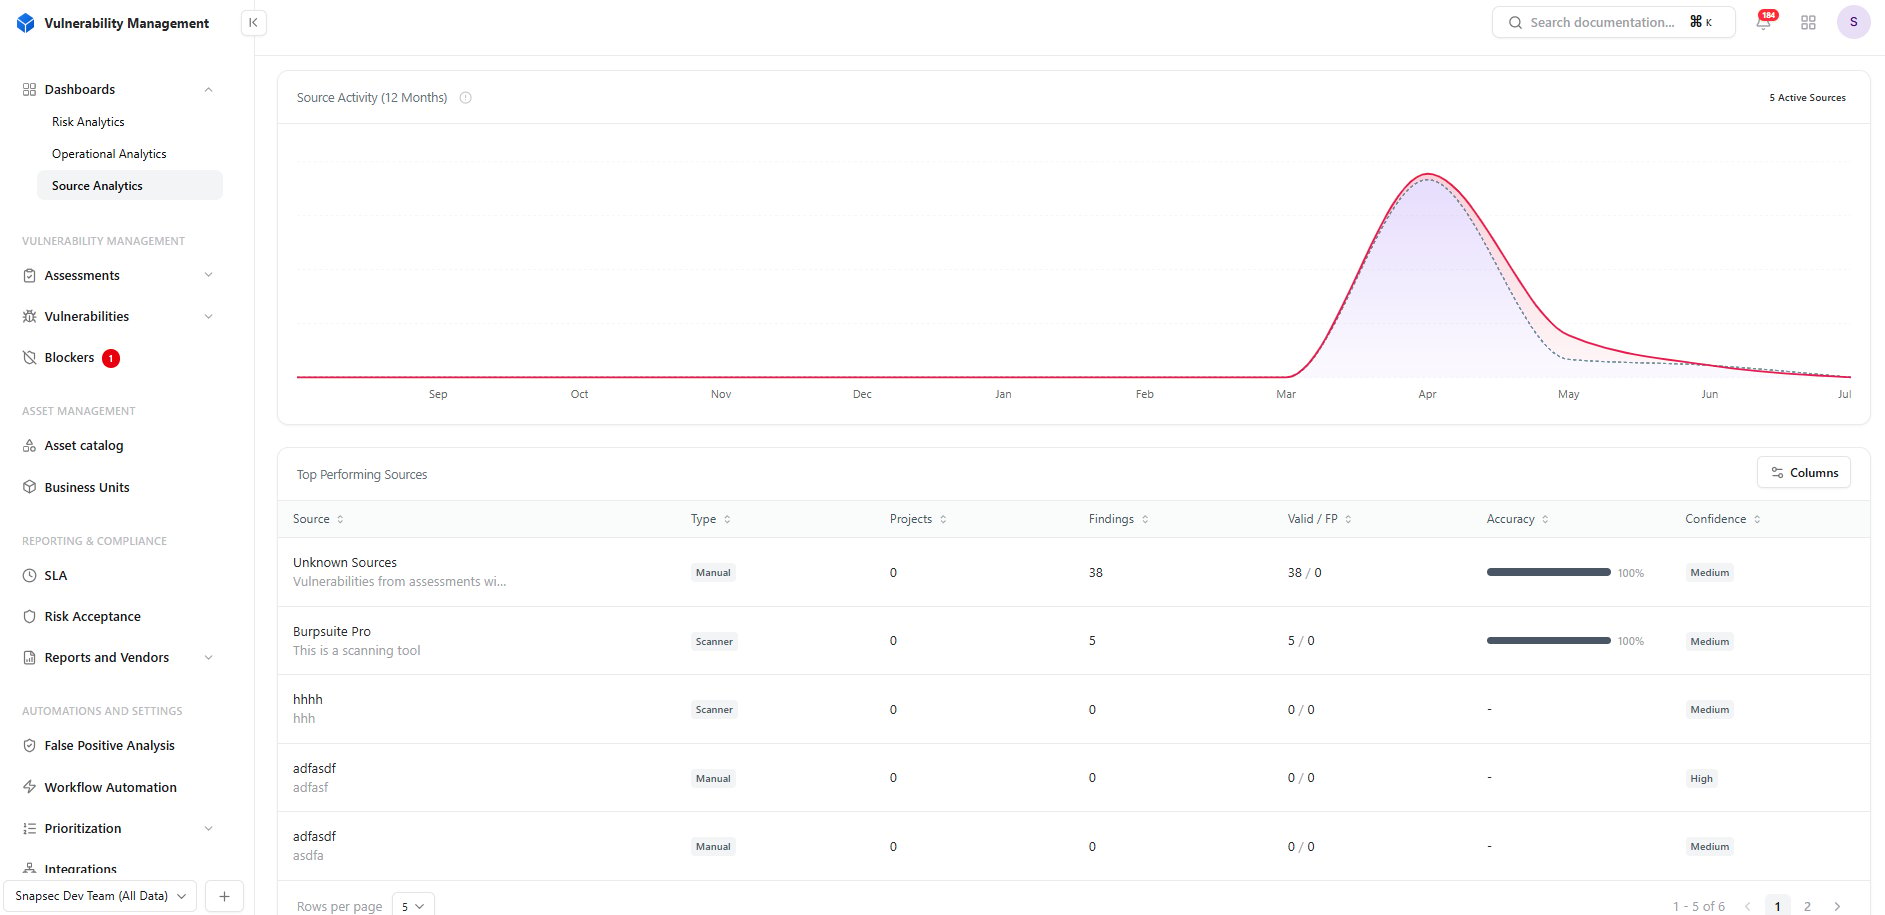
Sources inventory displaying configured scanners and their performance
Sources Inventory
The Sources Inventory provides a centralized list of every registered vulnerability source. Each entry includes:- Source Name
- Source Type
- Linked Projects
- Total Findings
- Valid Findings
- False Positives
- Accuracy Percentage
- Confidence Level
Managing Sources
Each source can be searched, filtered, and managed directly from the inventory. Common management tasks include:- Viewing source performance
- Comparing scanners
- Tracking confidence levels
- Reviewing historical activity
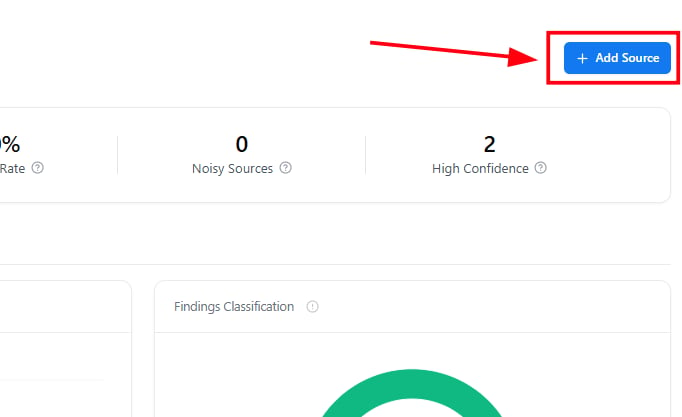
Register a new vulnerability source
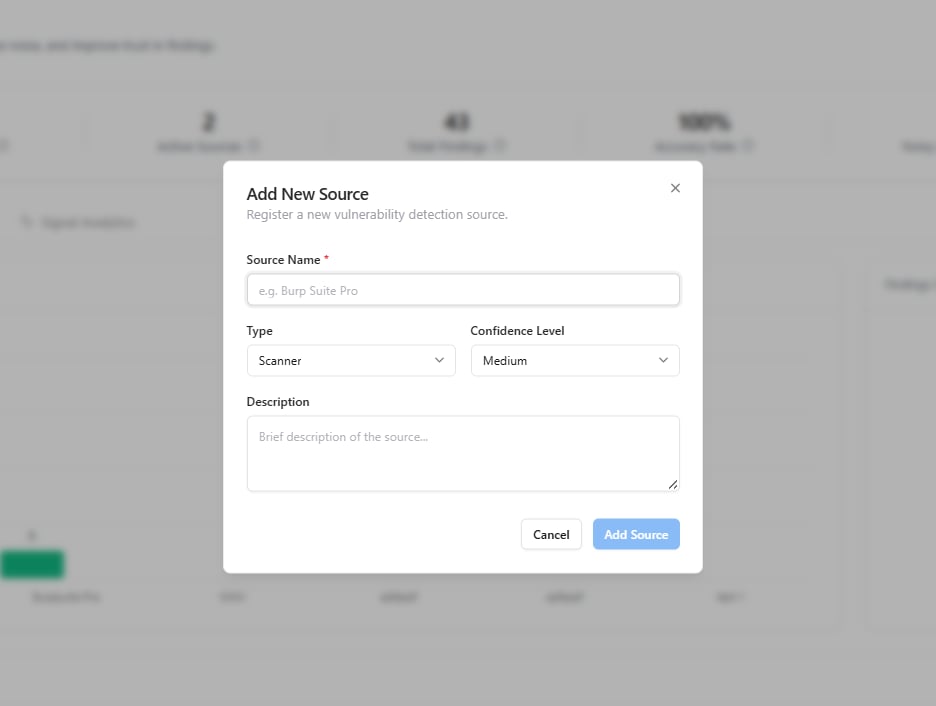
Registering a Source
New scanners and assessment tools can be added directly from the Source Analytics dashboard. When registering a source, configure:- Source Name
- Source Type
- Confidence Level
- Description
Signal Analytics measuring finding quality and scanner reliability
Sources List
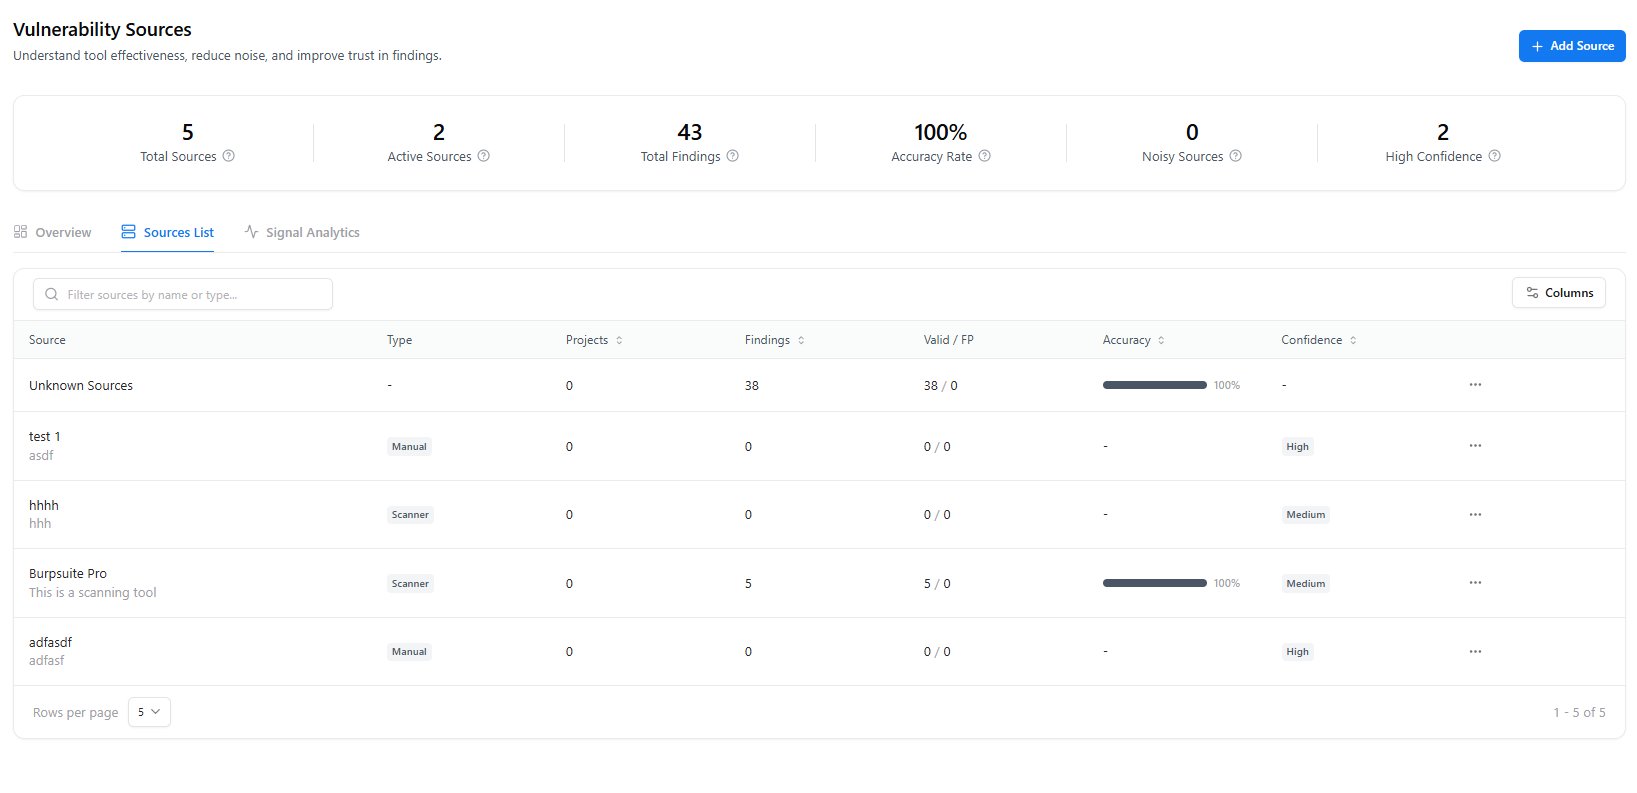
Sources List displaying all registered vulnerability sources and their performance metrics
Information Available
- Source Name
- Name and description of the registered source.
- Type
- Indicates whether the source is a scanner, manual source, or another supported type.
- Projects
- Number of projects associated with the source.
- Findings
- Total vulnerabilities reported by the source.
- Valid / False Positives
- Breakdown of validated findings versus false positives.
- Accuracy
- Overall accuracy score based on validated findings.
- Confidence
- Confidence level assigned to the source.
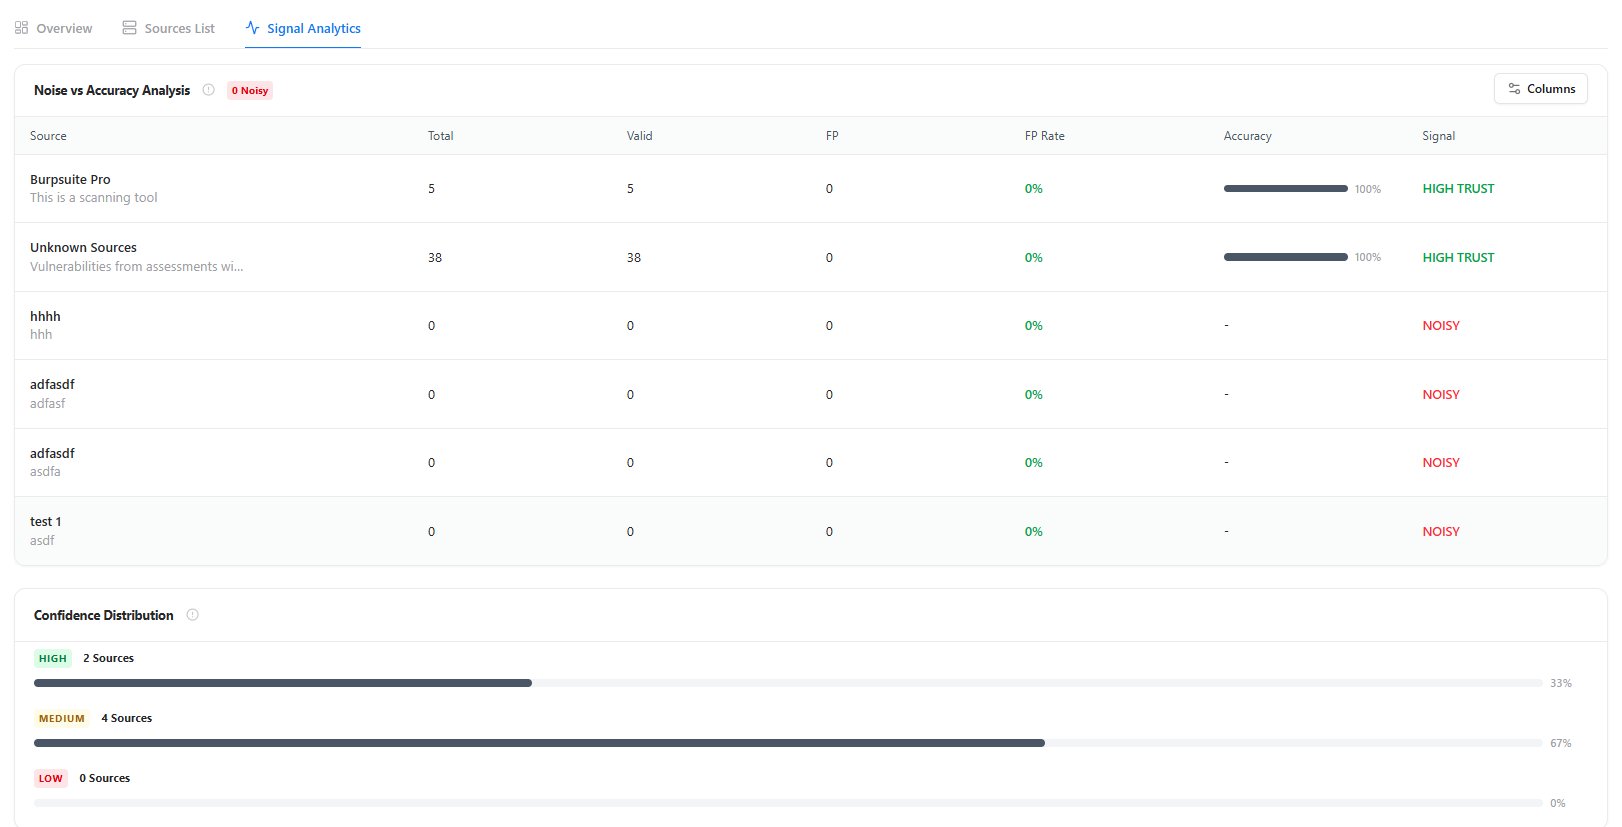
Signal Analytics showing scanner accuracy, noise analysis, and confidence distribution
Signal Analytics
Signal Analytics evaluates the quality and trustworthiness of vulnerability data collected from every integrated source. Rather than focusing on the number of findings, it measures how reliable each source is by analyzing accuracy and false-positive rates. This helps organizations identify trusted scanners, reduce noise, and improve overall vulnerability prioritization.Noise vs Accuracy Analysis
For every configured source, Snapsec measures:- Total Findings
- Valid Findings
- False Positives
- False Positive Rate
- Accuracy Percentage
- Signal Rating (High Trust or Noisy)
Confidence Distribution
The dashboard also provides a confidence breakdown across all registered sources, grouping them into:- High Confidence
- Sources consistently producing reliable, high-quality findings.
- Medium Confidence
- Sources with good accuracy that may require occasional validation.
- Low Confidence
- Sources generating inconsistent or low-confidence results.
Why Source Analytics Matters
Source Analytics enables organizations to continuously improve the quality of vulnerability data entering Snapsec VM. It helps teams:- Measure scanner effectiveness
- Reduce false positives
- Increase confidence in findings
- Optimize security tooling
- Improve vulnerability prioritization
- Build trust in remediation decisions