Overview
The ASM Dashboard provides a complete, real-time overview of your organization’s external attack surface.It helps you visualize discovered assets, exposed services, open ports, and potential risks — all aggregated from continuous reconnaissance and scanning. This centralized view enables security teams to track discovery trends, analyze exposure, and prioritize risk reduction efforts across their infrastructure.
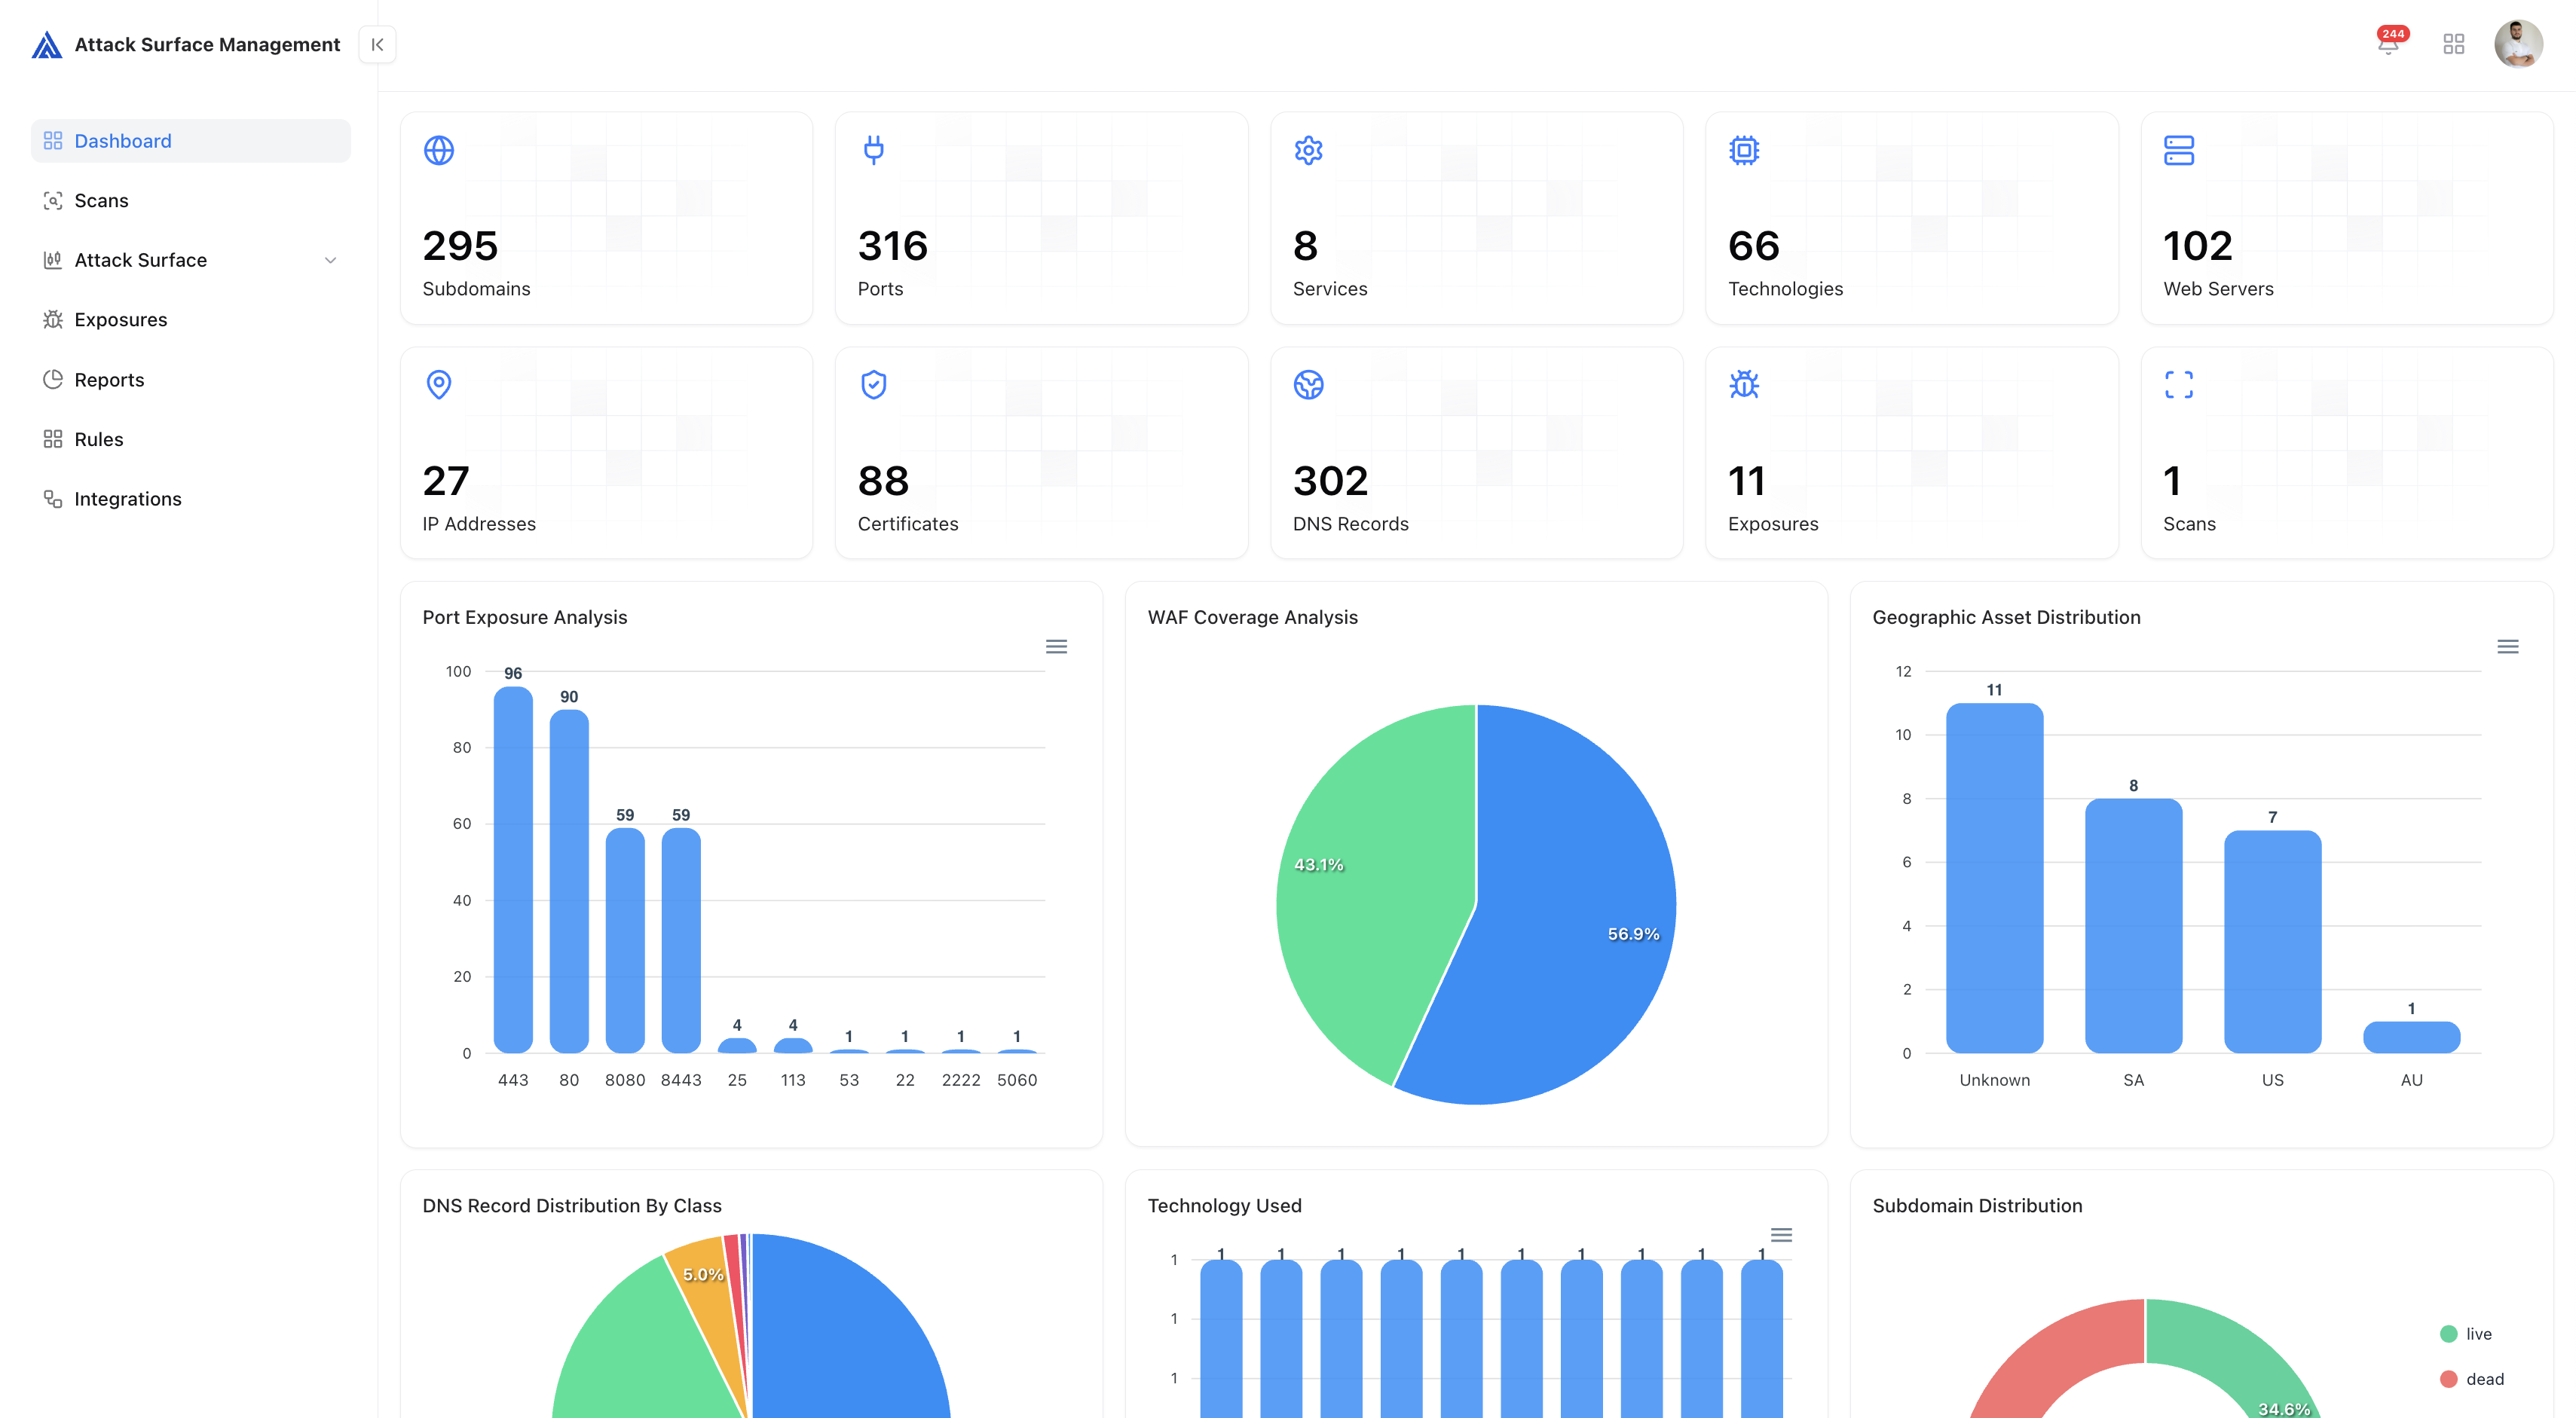
Attack Surface Overview Dashboard
Key Metrics
At the top of the dashboard, you’ll find a summary of core visibility and exposure metrics:| Metric | Description |
|---|---|
| Subdomains | Total discovered subdomains linked to your organization. |
| Ports | Unique open ports identified across hosts and IPs. |
| Services | Active services detected across the external network. |
| Technologies | Frameworks, platforms, and products identified during scanning. |
| Web Servers | Hosts serving HTTP/HTTPS content. |
| IP Addresses | Unique IPs associated with your assets. |
| Certificates | SSL/TLS certificates found across hosts. |
| DNS Records | Total DNS entries discovered. |
| Exposures | Known risks or misconfigurations identified. |
| Scans | The number of reconnaissance scans executed. |
Visual Analytics
The dashboard features multiple visual charts that break down your external posture.Port Exposure Analysis
Displays distribution of open ports (e.g., 80, 443, 8080) to help identify unnecessary exposures.
WAF Coverage Analysis
Shows what percentage of assets are protected by a Web Application Firewall (WAF).
Geographic Asset Distribution
Highlights the geographical location of your exposed assets, revealing region-based exposure trends.
DNS Record Distribution
Visualizes DNS record types (A, CNAME, TXT, MX, etc.) for better infrastructure mapping.
Technology Used
Summarizes detected technologies such as Nginx, React, jQuery, Node.js, etc.
Subdomain Distribution
Displays the percentage of live vs dead subdomains, reflecting cleanup and active surface size.
Value to Security Teams
- Instant Visibility: Understand your exposed assets at a glance.
- Data-Driven Prioritization: Identify critical areas with the most open ports or missing protections.
- Continuous Tracking: Visualize trends across scans to measure attack surface growth or reduction.
- Cross-Domain Insights: Correlate technologies, geolocations, and DNS data for deeper context.
Explore Live Demo
Explore ASM Live — No Signup Needed
Instantly explore how Snapsec Attack Surface Management (ASM) discovers external assets, identifies exposures, enriches attack surface data, and visualizes risk — all in real time, without creating an account.