> ## Documentation Index
> Fetch the complete documentation index at: https://docs.snapsec.co/llms.txt
> Use this file to discover all available pages before exploring further.
# Dasboard
> View, analyze, and manage detected vulnerabilities across all assets with full context and remediation workflows.
## Overview
The Dashboard page provides a centralized view of all detected security issues across your assets.
It enables teams to investigate findings, track remediation status, and take action on critical risks efficiently.
***
## Dashboard List
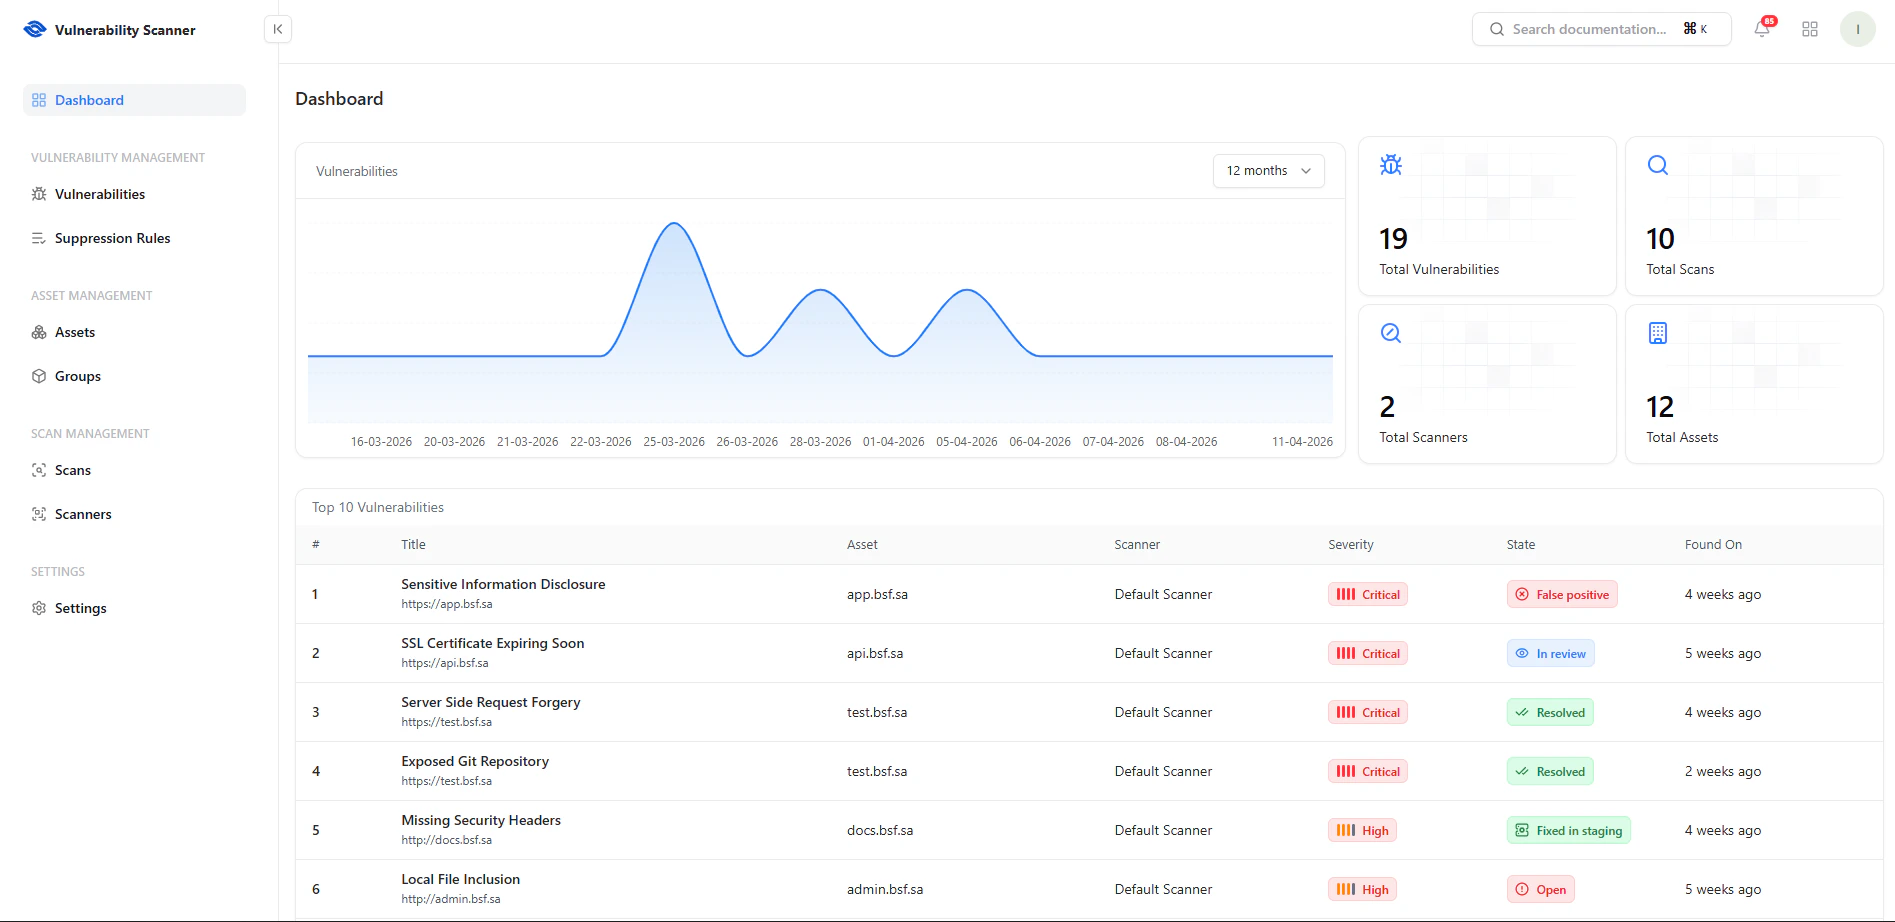 This table displays the most critical vulnerabilities across your environment.
### Key Columns
* **Title** — Vulnerability name and endpoint
* **Asset** — Affected system or domain
* **Scanner** — Detection source
* **Severity** — Critical, High, Medium, Low
* **State** — Open, Resolved, In Review, False Positive
* **Found On** — Detection timestamp
This enables quick prioritization of high-risk issues.
***
## Time-Based Analysis
This table displays the most critical vulnerabilities across your environment.
### Key Columns
* **Title** — Vulnerability name and endpoint
* **Asset** — Affected system or domain
* **Scanner** — Detection source
* **Severity** — Critical, High, Medium, Low
* **State** — Open, Resolved, In Review, False Positive
* **Found On** — Detection timestamp
This enables quick prioritization of high-risk issues.
***
## Time-Based Analysis
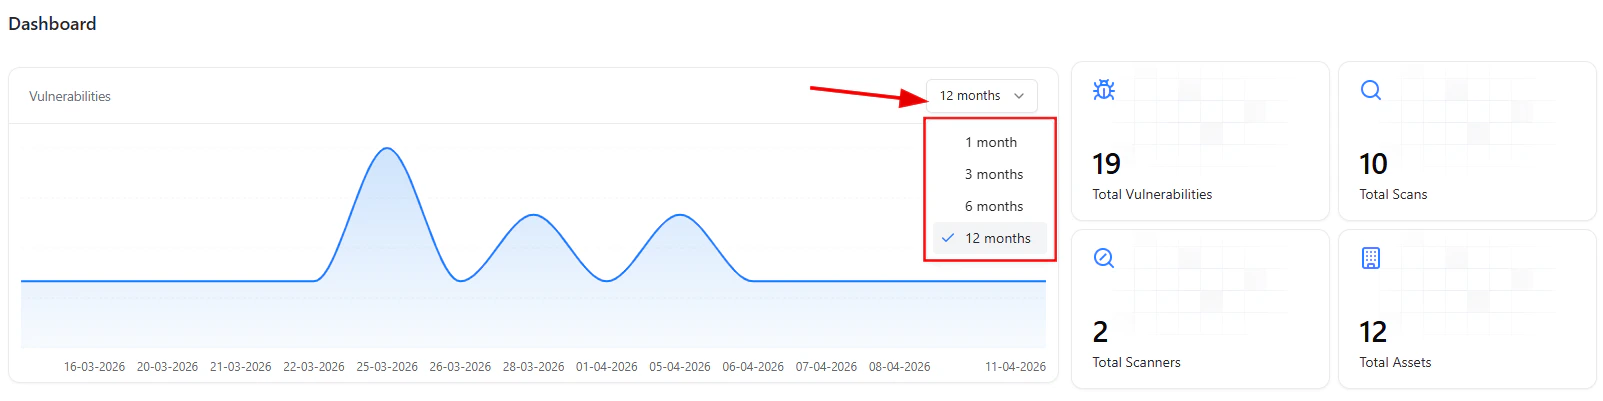 Use the time filter to analyze vulnerability patterns over time.
### Capabilities
* **Flexible Time Ranges** — 1, 3, 6, or 12 months
* **Trend Monitoring** — Identify spikes and recurring issues
* **Post-Remediation Tracking** — Validate fixes over time
This helps teams measure security improvements and detect anomalies.
***
## Vulnerability Details
Use the time filter to analyze vulnerability patterns over time.
### Capabilities
* **Flexible Time Ranges** — 1, 3, 6, or 12 months
* **Trend Monitoring** — Identify spikes and recurring issues
* **Post-Remediation Tracking** — Validate fixes over time
This helps teams measure security improvements and detect anomalies.
***
## Vulnerability Details
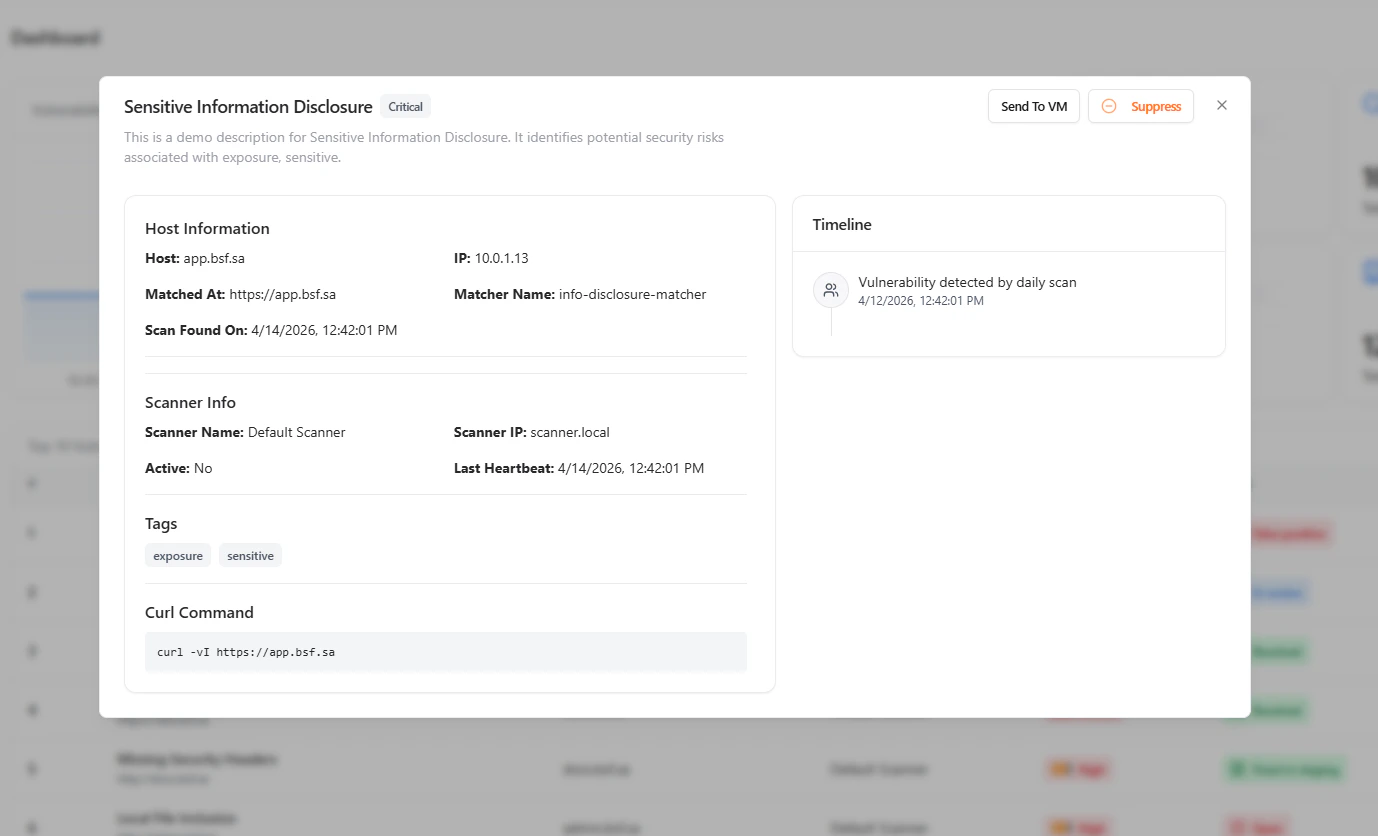 Clicking a vulnerability opens a detailed investigation panel.
### Host Information
* **Host / Domain**
* **IP Address**
* **Matched Endpoint**
* **Detection Timestamp**
* **Matcher Name**
### Scanner Information
* **Scanner Name**
* **Scanner IP**
* **Heartbeat Status**
### Additional Context
* **Tags** — Classification labels
* **Timeline** — Detection history
* **Reproduction Command** — Example request (curl)
***
## Actions
Each vulnerability supports direct actions:
* **Send to VM** — Forward to Vulnerability Management
* **Suppress** — Mark as false positive or ignore
This ensures findings are actionable and manageable.
***
## Investigation Workflow
A typical workflow includes:
1. Identify critical vulnerabilities
2. Analyze trends and patterns
3. Investigate detailed findings
4. Take action (fix, suppress, escalate)
5. Track resolution over time
***
## Why This Matters
* Centralizes vulnerability visibility
* Enables faster triage and response
* Provides deep investigation context
* Supports trend-based decision making
* Improves remediation efficiency
***
## Explore Live Demo
See how Snapsec VS helps you detect, analyze, and act on vulnerabilities across your infrastructure in real-time.
Clicking a vulnerability opens a detailed investigation panel.
### Host Information
* **Host / Domain**
* **IP Address**
* **Matched Endpoint**
* **Detection Timestamp**
* **Matcher Name**
### Scanner Information
* **Scanner Name**
* **Scanner IP**
* **Heartbeat Status**
### Additional Context
* **Tags** — Classification labels
* **Timeline** — Detection history
* **Reproduction Command** — Example request (curl)
***
## Actions
Each vulnerability supports direct actions:
* **Send to VM** — Forward to Vulnerability Management
* **Suppress** — Mark as false positive or ignore
This ensures findings are actionable and manageable.
***
## Investigation Workflow
A typical workflow includes:
1. Identify critical vulnerabilities
2. Analyze trends and patterns
3. Investigate detailed findings
4. Take action (fix, suppress, escalate)
5. Track resolution over time
***
## Why This Matters
* Centralizes vulnerability visibility
* Enables faster triage and response
* Provides deep investigation context
* Supports trend-based decision making
* Improves remediation efficiency
***
## Explore Live Demo
See how Snapsec VS helps you detect, analyze, and act on vulnerabilities across your infrastructure in real-time.