> ## Documentation Index
> Fetch the complete documentation index at: https://docs.snapsec.co/llms.txt
> Use this file to discover all available pages before exploring further.
# Asset Catalog
> Gain complete visibility into your attack surface with real-time asset intelligence and vulnerability correlation.
 ## Overview
The **Asset Catalog** provides a centralized, real-time view of all assets discovered across your environment — including subdomains, applications, IPs, and infrastructure components.
It combines **asset intelligence + vulnerability context** into a single interface, allowing teams to quickly understand:
* What assets exist
* Which assets are vulnerable
* How risk is distributed
* What needs immediate attention
Each asset is enriched with ownership, vulnerability counts, and remediation progress — enabling faster prioritization and accountability.
Every asset is continuously mapped to vulnerabilities — giving you a live view of your attack surface risk.
***
## Asset Intelligence Dashboard
## Overview
The **Asset Catalog** provides a centralized, real-time view of all assets discovered across your environment — including subdomains, applications, IPs, and infrastructure components.
It combines **asset intelligence + vulnerability context** into a single interface, allowing teams to quickly understand:
* What assets exist
* Which assets are vulnerable
* How risk is distributed
* What needs immediate attention
Each asset is enriched with ownership, vulnerability counts, and remediation progress — enabling faster prioritization and accountability.
Every asset is continuously mapped to vulnerabilities — giving you a live view of your attack surface risk.
***
## Asset Intelligence Dashboard
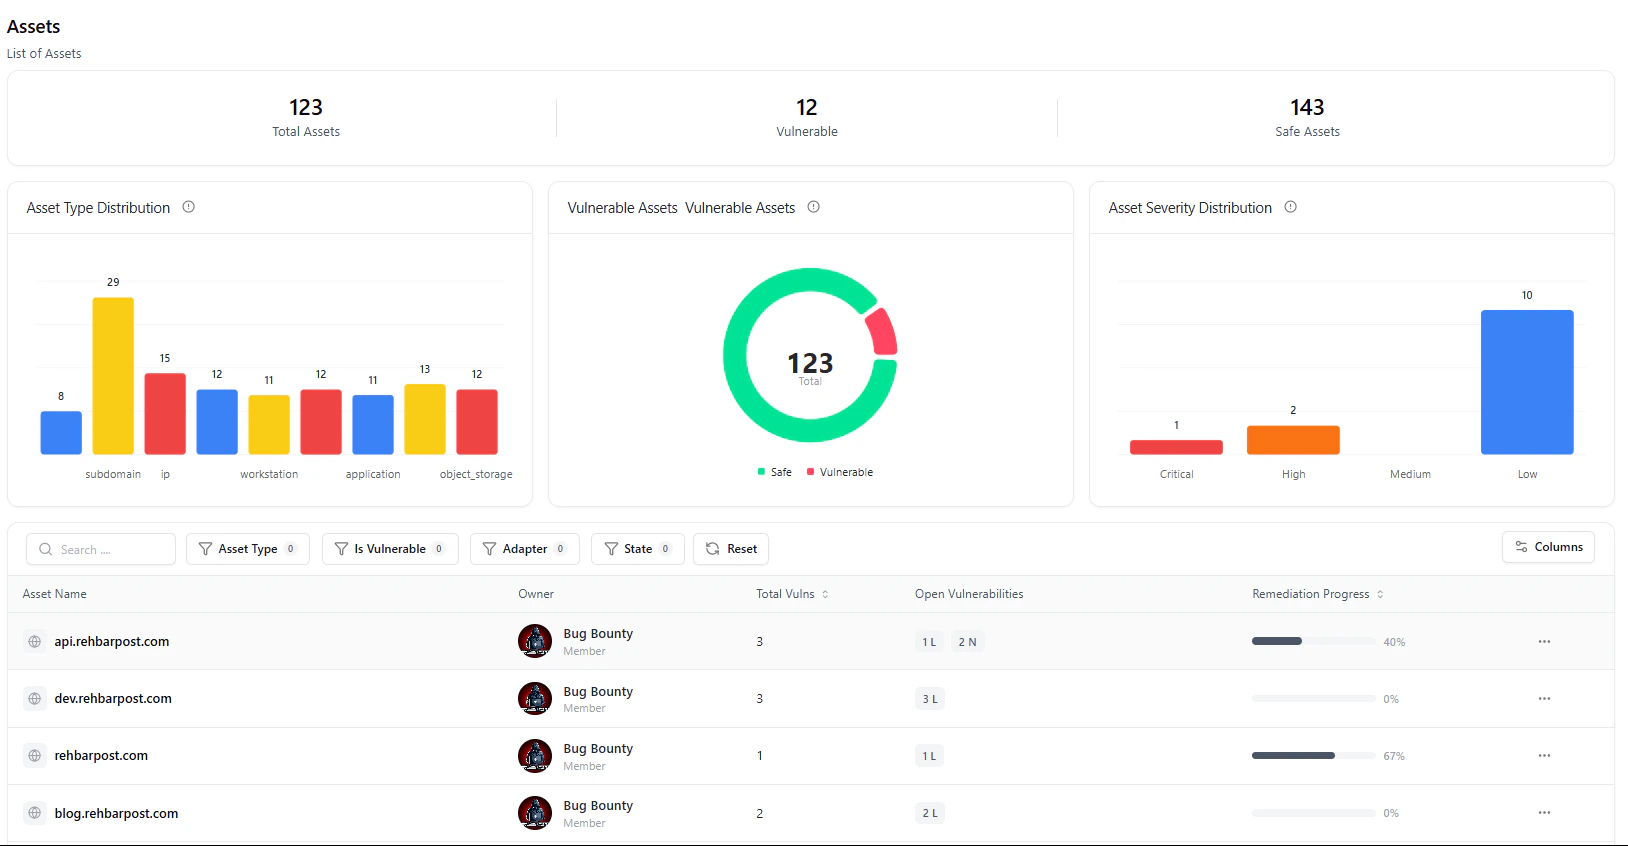
 The top section provides a **quick snapshot of your entire asset landscape**.
### Key Insights
* **Total Assets**
* Total number of discovered assets across all sources
* **Vulnerable Assets**
* Assets currently affected by one or more vulnerabilities
* **Safe Assets**
* Assets with no active vulnerabilities
***
### Visual Breakdowns
* **Asset Type Distribution**
* Understand the composition of your environment (subdomains, IPs, apps, storage, etc.)
* **Vulnerable vs Safe Assets**
* Instantly assess overall exposure
* **Severity Distribution**
* Identify where critical, high, and low-risk assets exist
These visual insights help security teams prioritize high-risk asset categories first.
***
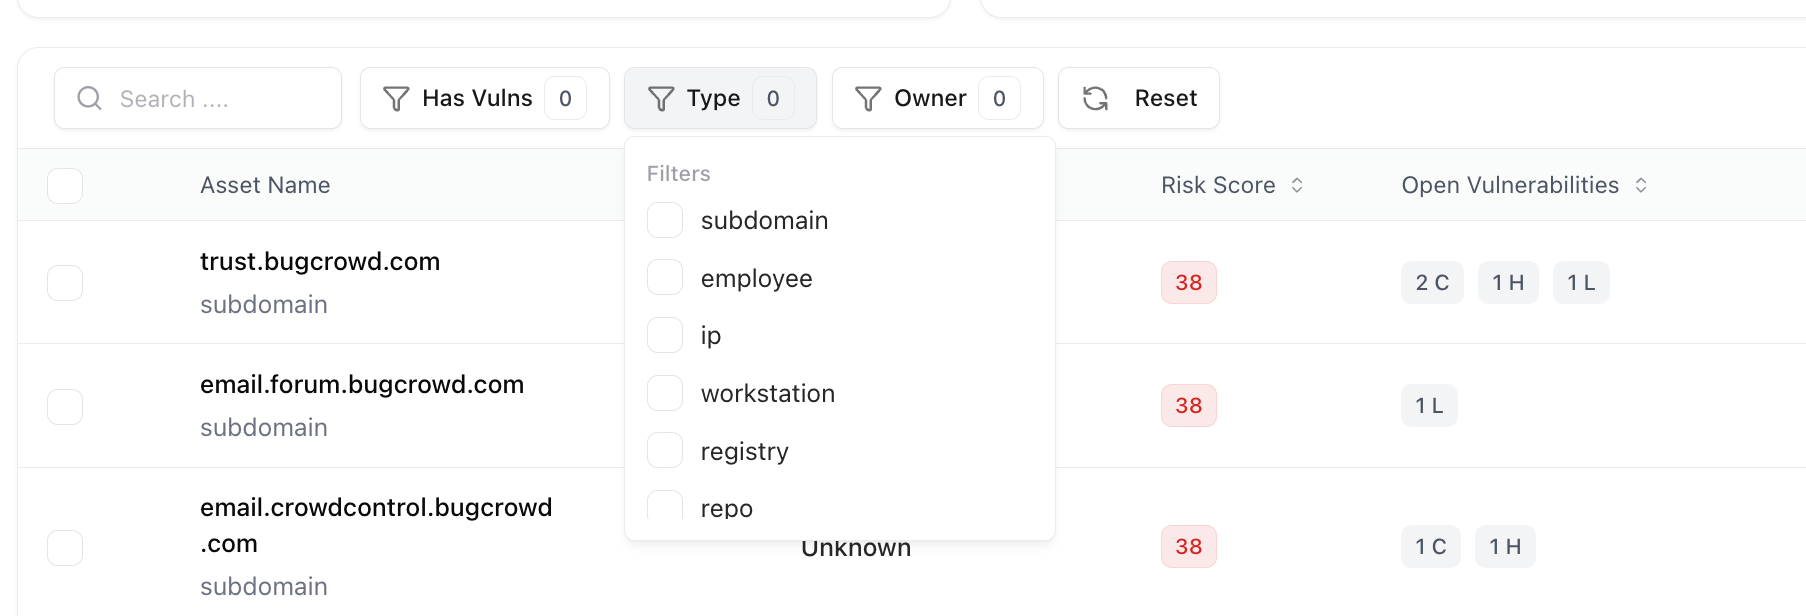
## Filters
Use filters at the top of the table to refine your asset view quickly.\
You can filter assets by:
* **Asset Type**
* **Is Vulnerable**
* **Adapter (source integration)**
* **State**
The top section provides a **quick snapshot of your entire asset landscape**.
### Key Insights
* **Total Assets**
* Total number of discovered assets across all sources
* **Vulnerable Assets**
* Assets currently affected by one or more vulnerabilities
* **Safe Assets**
* Assets with no active vulnerabilities
***
### Visual Breakdowns
* **Asset Type Distribution**
* Understand the composition of your environment (subdomains, IPs, apps, storage, etc.)
* **Vulnerable vs Safe Assets**
* Instantly assess overall exposure
* **Severity Distribution**
* Identify where critical, high, and low-risk assets exist
These visual insights help security teams prioritize high-risk asset categories first.
***
## Filters
Use filters at the top of the table to refine your asset view quickly.\
You can filter assets by:
* **Asset Type**
* **Is Vulnerable**
* **Adapter (source integration)**
* **State**
 ***
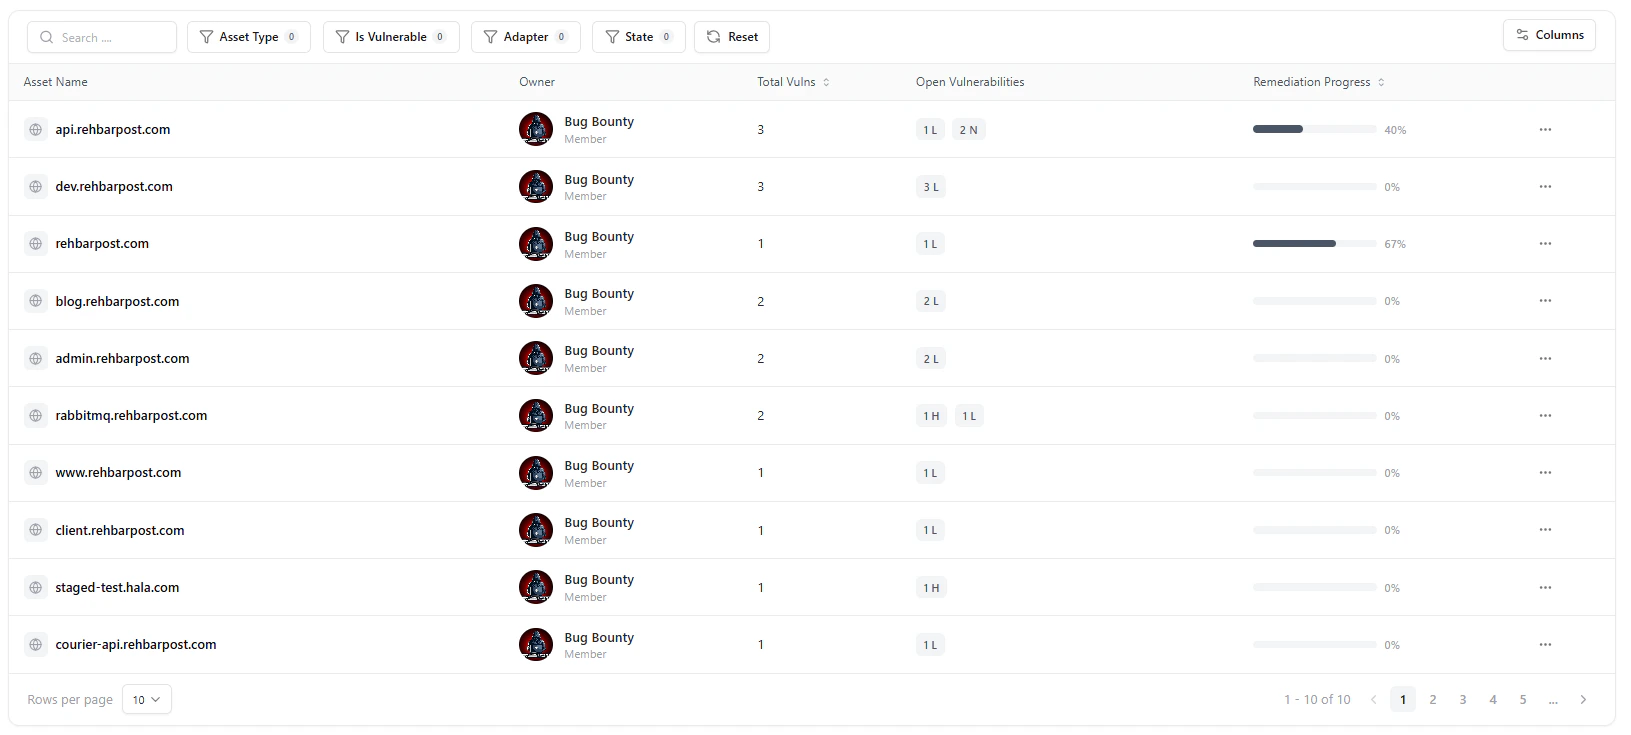
## Asset Inventory Table
The asset table provides a **detailed, actionable view** of every asset.
### Key Columns
* **Asset Name**
* Domain, subdomain, or resource identifier
* **Owner**
* Assigned team or user responsible for the asset
* **Total Vulnerabilities**
* Total number of findings linked to the asset
* **Open Vulnerabilities**
* Breakdown by severity (e.g., High, Low, Info)
* **Remediation Progress**
* Percentage of resolved vulnerabilities
Click any asset to drill down into its full vulnerability list and detailed findings.
***
## Vulnerability Correlation
Each asset is automatically linked to vulnerabilities identified across:
* Assessments
* Scanners and integrations
* Manual testing
This ensures that every finding is tied to its originating asset, giving complete traceability and context.
Assets and vulnerabilities stay continuously synchronized — no manual linking required.
***
## Remediation Progress
Each asset includes a **Remediation Progress Bar** showing the percentage of resolved vs. open vulnerabilities.\
This metric allows teams to track closure rates and measure the impact of their ongoing fixes.
***
## Asset Inventory Table
The asset table provides a **detailed, actionable view** of every asset.
### Key Columns
* **Asset Name**
* Domain, subdomain, or resource identifier
* **Owner**
* Assigned team or user responsible for the asset
* **Total Vulnerabilities**
* Total number of findings linked to the asset
* **Open Vulnerabilities**
* Breakdown by severity (e.g., High, Low, Info)
* **Remediation Progress**
* Percentage of resolved vulnerabilities
Click any asset to drill down into its full vulnerability list and detailed findings.
***
## Vulnerability Correlation
Each asset is automatically linked to vulnerabilities identified across:
* Assessments
* Scanners and integrations
* Manual testing
This ensures that every finding is tied to its originating asset, giving complete traceability and context.
Assets and vulnerabilities stay continuously synchronized — no manual linking required.
***
## Remediation Progress
Each asset includes a **Remediation Progress Bar** showing the percentage of resolved vs. open vulnerabilities.\
This metric allows teams to track closure rates and measure the impact of their ongoing fixes.
 You can also perform quick actions on any asset:
Highlight critical assets that require continuous monitoring.
Ensure accountability by assigning assets to teams or individuals.
Perform actions like updating metadata or removing outdated entries.
***
## Explore Live Demo
Experience how Snapsec delivers real-time asset visibility with vulnerability-driven prioritization.
You can also perform quick actions on any asset:
Highlight critical assets that require continuous monitoring.
Ensure accountability by assigning assets to teams or individuals.
Perform actions like updating metadata or removing outdated entries.
***
## Explore Live Demo
Experience how Snapsec delivers real-time asset visibility with vulnerability-driven prioritization.